Virgin Media 2006 Annual Report Download - page 150
Download and view the complete annual report
Please find page 150 of the 2006 Virgin Media annual report below. You can navigate through the pages in the report by either clicking on the pages listed below, or by using the keyword search tool below to find specific information within the annual report.-
 1
1 -
2
-
3
-
4
-
5
-
6
-
7
-
8
-
9
-
10
-
11
-
12
-
13
-
14
-
15
-
16
-
17
-
18
-
19
-
20
-
21
-
22
-
23
-
24
-
25
-
26
-
27
-
28
-
29
-
30
-
31
-
32
-
33
-
34
-
35
-
36
-
37
-
38
-
39
-
40
-
41
-
42
-
43
-
44
-
45
-
46
-
47
-
48
-
49
-
50
-
51
-
52
-
53
-
54
-
55
-
56
-
57
-
58
-
59
-
60
-
61
-
62
-
63
-
64
-
65
-
66
-
67
-
68
-
69
-
70
-
71
-
72
-
73
-
74
-
75
-
76
-
77
-
78
-
79
-
80
-
81
-
82
-
83
-
84
-
85
-
86
-
87
-
88
-
89
-
90
-
91
-
92
-
93
-
94
-
95
-
96
-
97
-
98
-
99
-
100
-
101
-
102
-
103
-
104
-
105
-
106
-
107
-
108
-
109
-
110
-
111
-
112
-
113
-
114
-
115
-
116
-
117
-
118
-
119
-
120
-
121
-
122
-
123
-
124
-
125
-
126
-
127
-
128
-
129
-
130
-
131
-
132
-
133
-
134
-
135
-
136
-
137
-
138
-
139
-
 140
140 -
 141
141 -
 142
142 -
 143
143 -
 144
144 -
 145
145 -
 146
146 -
 147
147 -
 148
148 -
 149
149 -
 150
150 -
 151
151 -
 152
152 -
 153
153 -
 154
154 -
 155
155 -
 156
156 -
 157
157 -
 158
158 -
 159
159 -
 160
160 -
161
-
162
-
163
-
164
-
165
-
166
-
167
-
168
-
169
-
170
-
171
-
172
-
173
-
174
-
175
-
176
-
177
-
178
-
179
-
180
-
181
-
182
-
183
-
184
-
185
-
186
-
187
-
188
-
189
-
190
-
191
-
192
-
193
-
194
-
195
-
196
-
197
-
198
-
199
-
200
-
201
-
202
-
203
-
204
-
205
-
206
-
207
-
208
-
209
-
210
-
211
-
212
-
213
-
214
-
215
-
216
-
217
-
218
-
219
-
220
-
221
-
222
-
223
-
224
-
225
-
226
-
227
-
228
-
229
-
230
-
231
-
232
-
233
-
234
-
235
-
236
-
237
-
238
-
239
-
240
-
241
-
242
-
243
-
244
-
245
-
246
-
247
-
248
-
249
-
250
-
251
-
252
-
253
-
254
-
255
-
256
-
257
-
258
-
259
-
260
-
261
-
262
-
263
-
264
-
265
-
266
-
267
-
268
-
269
-
270
-
271
-
272
-
273
-
274
-
275
-
276
 |
 |

VIRGIN MEDIA INVESTMENT HOLDINGS LIMITED AND SUBSIDIARIES
NOTES TO CONSOLIDATED FINANCIAL STATEMENTS (Continued)
2. Significant Accounting Policies (Continued)
Concentrations of Credit Risk
Our financial instruments that are exposed to concentrations of credit risk consist primarily of trade receivables. Concentrations
of credit risk with respect to trade receivables are limited because of the large number of customers and their dispersion across
geographic areas. We perform periodic credit evaluations of our Business customers’ financial condition and generally do not require
collateral. At December 31, 2006, we did not have significant credit risk concentrations. No single group or customer represents
greater than 10% of total accounts receivable.
Inventory
Inventory consists of consumer goods for re−sale and programming inventory. Consumer goods for re−sale are valued at the
lower of cost or market value using the first−in, first−out (“FIFO”) method. Cost represents the as invoiced purchase cost of inventory.
This valuation requires us to make judgments, based on currently available information, about obsolete, slow−moving or defective
inventory. Based upon these judgments and estimates, which are applied consistently from period to period, we adjust the carrying
amount of our inventory for re−sale to the lower of cost or market value.
Programming inventory represents television programming libraries held by each of our television channels and is stated at the
lower of cost or market value. Programming is recognized as inventory when a contractual purchase obligation exists, it has been
delivered to us and is within its permitted broadcasting period. Programming inventory is periodically reviewed and a provision made
for impairment or obsolescence.
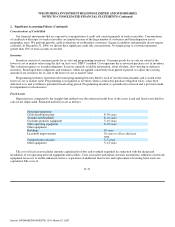
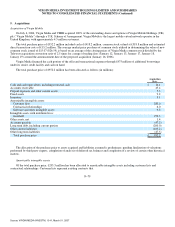
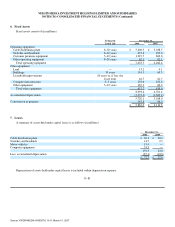
Fixed Assets
Depreciation is computed by the straight−line method over the estimated useful lives of the assets. Land and fixed assets held for
sale are not depreciated. Estimated useful lives are as follows:
Operating equipment:
Cable distribution plant 8−30 years
Switches and headends 8−10 years
Customer premises equipment 5−10 years
Other operating equipment 8−20 years
Other equipment:
Buildings 30 years
Leasehold improvements 20 years or, if less, the lease
term
Computer infrastructure 3−5 years
Other equipment 5−12 years
The cost of fixed assets includes amounts capitalized for labor and overhead expended in connection with the design and
installation of our operating network equipment and facilities. Costs associated with initial customer installations, additions of network
equipment necessary to enable enhanced services, acquisition of additional fixed assets and replacement of existing fixed assets are
capitalized. The costs of
F−71
Source: VIRGIN MEDIA INVESTM, 10−K, March 01, 2007