Virgin Media 2006 Annual Report Download - page 171
Download and view the complete annual report
Please find page 171 of the 2006 Virgin Media annual report below. You can navigate through the pages in the report by either clicking on the pages listed below, or by using the keyword search tool below to find specific information within the annual report.-
 1
1 -
2
-
3
-
4
-
5
-
6
-
7
-
8
-
9
-
10
-
11
-
12
-
13
-
14
-
15
-
16
-
17
-
18
-
19
-
20
-
21
-
22
-
23
-
24
-
25
-
26
-
27
-
28
-
29
-
30
-
31
-
32
-
33
-
34
-
35
-
36
-
37
-
38
-
39
-
40
-
41
-
42
-
43
-
44
-
45
-
46
-
47
-
48
-
49
-
50
-
51
-
52
-
53
-
54
-
55
-
56
-
57
-
58
-
59
-
60
-
61
-
62
-
63
-
64
-
65
-
66
-
67
-
68
-
69
-
70
-
71
-
72
-
73
-
74
-
75
-
76
-
77
-
78
-
79
-
80
-
81
-
82
-
83
-
84
-
85
-
86
-
87
-
88
-
89
-
90
-
91
-
92
-
93
-
94
-
95
-
96
-
97
-
98
-
99
-
100
-
101
-
102
-
103
-
104
-
105
-
106
-
107
-
108
-
109
-
110
-
111
-
112
-
113
-
114
-
115
-
116
-
117
-
118
-
119
-
120
-
121
-
122
-
123
-
124
-
125
-
126
-
127
-
128
-
129
-
130
-
131
-
132
-
133
-
134
-
135
-
136
-
137
-
138
-
139
-
140
-
141
-
142
-
143
-
144
-
145
-
146
-
147
-
148
-
149
-
150
-
151
-
152
-
153
-
154
-
155
-
156
-
157
-
158
-
159
-
160
-
 161
161 -
 162
162 -
 163
163 -
 164
164 -
 165
165 -
 166
166 -
 167
167 -
 168
168 -
 169
169 -
 170
170 -
 171
171 -
 172
172 -
 173
173 -
 174
174 -
 175
175 -
 176
176 -
 177
177 -
 178
178 -
 179
179 -
 180
180 -
 181
181 -
182
-
183
-
184
-
185
-
186
-
187
-
188
-
189
-
190
-
191
-
192
-
193
-
194
-
195
-
196
-
197
-
198
-
199
-
200
-
201
-
202
-
203
-
204
-
205
-
206
-
207
-
208
-
209
-
210
-
211
-
212
-
213
-
214
-
215
-
216
-
217
-
218
-
219
-
220
-
221
-
222
-
223
-
224
-
225
-
226
-
227
-
228
-
229
-
230
-
231
-
232
-
233
-
234
-
235
-
236
-
237
-
238
-
239
-
240
-
241
-
242
-
243
-
244
-
245
-
246
-
247
-
248
-
249
-
250
-
251
-
252
-
253
-
254
-
255
-
256
-
257
-
258
-
259
-
260
-
261
-
262
-
263
-
264
-
265
-
266
-
267
-
268
-
269
-
270
-
271
-
272
-
273
-
274
-
275
-
276
 |
 |

VIRGIN MEDIA INVESTMENT HOLDINGS LIMITED AND SUBSIDIARIES
NOTES TO CONSOLIDATED FINANCIAL STATEMENTS (Continued)
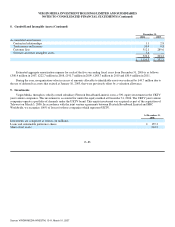
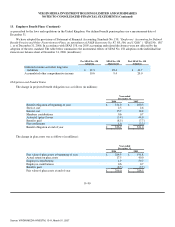
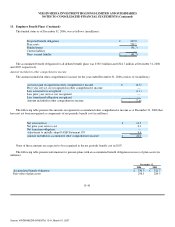
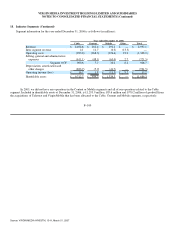
13. Employee Benefit Plans (Continued)
The following table presents information for pension plans with a projected benefit obligation in excess of plan assets (in
millions):
December 31,
2006 2005
Projected benefit obligation £ 336.9 £ 331.0
Fair value of plan assets 296.0 284.5
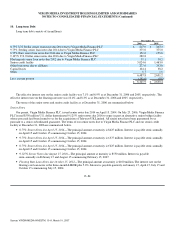
The components of net periodic benefit costs were as follows (in millions):
Year ended December 31,
2006 2005 2004
Service cost £ 2.5 £ 2.6 £ 6.1
Interest cost 15.7 14.4 13.7
Expected return on plan assets (16.7) (15.0) (13.6)
Recognized actuarial loss 1.1 — (0.1)
Plan settlements 1.0 0.6 1.3
Total net periodic benefit cost £ 3.6 £ 2.6 £ 7.4
As a result of the sale of our Broadcast operations on December 1, 2004, we have retained the earned pension and other
post−retirement benefits liabilities related to certain employees of the Broadcast operations. Accordingly, the information disclosed in
the tables above includes amounts relating to liabilities of these employees.
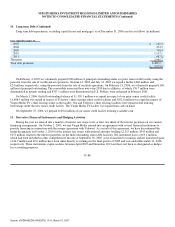
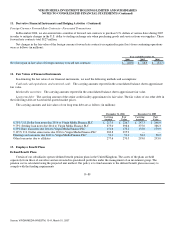
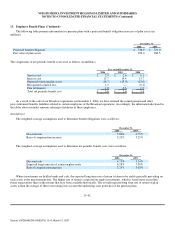
Assumptions
The weighted−average assumptions used to determine benefit obligations were as follows:
December 31,
2006 2005
Discount rate 5.00% 4.75%
Rate of compensation increase 3.25% 3.25%
The weighted−average assumptions used to determine net periodic benefit costs were as follows:
December 31,
2006 2005
Discount rate 4.75% 5.24%
Expected long term rate of return on plan assets 6.28% 7.08%
Rate of compensation increase 3.25% 3.03%
Where investments are held in bonds and cash, the expected long term rate of return is taken to be yields generally prevailing on
such assets at the measurement date. The higher rate of return is expected on equity investments, which is based more on realistic
future expectations than on the returns that have been available historically. The overall expected long term rate of return on plan
assets is then the average of these rates taking into account the underlying asset portfolios of the pension plans.
F−92
Source: VIRGIN MEDIA INVESTM, 10−K, March 01, 2007