Tyson Foods 2012 Annual Report Download - page 78
Download and view the complete annual report
Please find page 78 of the 2012 Tyson Foods annual report below. You can navigate through the pages in the report by either clicking on the pages listed below, or by using the keyword search tool below to find specific information within the annual report.-
 1
1 -
2
-
3
-
4
-
5
-
6
-
7
-
8
-
9
-
10
-
11
-
12
-
13
-
14
-
15
-
16
-
17
-
18
-
19
-
20
-
21
-
22
-
23
-
24
-
25
-
26
-
27
-
28
-
29
-
30
-
31
-
32
-
33
-
34
-
35
-
36
-
37
-
38
-
39
-
40
-
41
-
42
-
43
-
44
-
45
-
46
-
47
-
48
-
49
-
50
-
51
-
52
-
53
-
54
-
55
-
56
-
57
-
58
-
59
-
60
-
61
-
62
-
63
-
64
-
65
-
66
-
67
-
 68
68 -
 69
69 -
 70
70 -
 71
71 -
 72
72 -
 73
73 -
 74
74 -
 75
75 -
 76
76 -
 77
77 -
 78
78 -
 79
79 -
 80
80 -
 81
81 -
 82
82 -
 83
83 -
 84
84 -
 85
85 -
 86
86 -
 87
87 -
 88
88 -
89
-
90
-
91
 |
 |

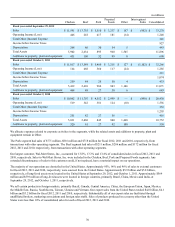
78
Condensed Consolidating Balance Sheet as of October 1, 2011 in millions
TFI
Parent TFM
Parent Non-
Guarantors Eliminations Total
Assets
Current Assets:
Cash and cash equivalents $ 1 $ 1 $ 714 $ — $ 716
Accounts receivable, net 1 506 813 1 1,321
Inventories 2 926 1,659 — 2,587
Other current assets 62 95 83 (84) 156
Total Current Assets 66 1,528 3,269 (83) 4,780
Net Property, Plant and Equipment 37 875 2,911 — 3,823
Goodwill — 881 1,011 — 1,892
Intangible Assets — 31 118 — 149
Other Assets 2,179 180 260 (2,192) 427
Investment in Subsidiaries 11,396 1,923 — (13,319) —
Total Assets $ 13,678 $ 5,418 $ 7,569 $ (15,594) $ 11,071
Liabilities and Shareholders’ Equity
Current Liabilities:
Current debt $ 2 $ — $ 68 $ — $ 70
Accounts payable 8 525 731 — 1,264
Other current liabilities 5,808 144 843 (5,755) 1,040
Total Current Liabilities 5,818 669 1,642 (5,755) 2,374
Long-Term Debt 1,972 1,198 1,005 (2,063) 2,112
Deferred Income Taxes — 120 319 (15) 424
Other Liabilities 231 142 217 (114) 476
Total Tyson Shareholders’ Equity 5,657 3,289 4,358 (7,647) 5,657
Noncontrolling Interest ——28—28
Total Shareholders’ Equity 5,657 3,289 4,386 (7,647) 5,685
Total Liabilities and Shareholders’ Equity $ 13,678 $ 5,418 $ 7,569 $ (15,594) $ 11,071
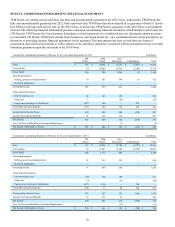
Condensed Consolidating Statement of Cash Flows for the year ended September 29, 2012 in millions
TFI
Parent TFM
Parent Non-
Guarantors Eliminations Total
Cash Provided by (Used for) Operating Activities $ 312 $ 438 $ 447 $ (10) $ 1,187
Cash Flows from Investing Activities:
Additions to property, plant and equipment (1) (104) (585) — (690)
(Purchases of)/Proceeds from marketable securities, net — (7) (4) — (11)
Proceeds from notes receivable —————
Change in restricted cash to be used for investing activities —————
Other, net 1 5 35 — 41
Cash Provided by (Used for) Investing Activities — (106) (554) — (660)
Cash Flows from Financing Activities:
Net change in debt 107 — 16 — 123
Purchase of redeemable noncontrolling interest —————
Change in restricted cash to be used for financing activities —————
Purchases of Tyson Class A common stock (264) — — — (264)
Dividends (57) — (10) 10 (57)
Other, net 26 — 1 — 27
Net change in intercompany balances (124) (324) 448 — —
Cash Provided by (Used for) Financing Activities (312) (324) 455 10 (171)
Effect of Exchange Rate Change on Cash — — (1) — (1)
Increase (Decrease) in Cash and Cash Equivalents — 8 347 — 355
Cash and Cash Equivalents at Beginning of Year 1 1 714 — 716
Cash and Cash Equivalents at End of Period $ 1 $ 9 $ 1,061 $ — $ 1,071