Tyson Foods 2012 Annual Report Download - page 25
Download and view the complete annual report
Please find page 25 of the 2012 Tyson Foods annual report below. You can navigate through the pages in the report by either clicking on the pages listed below, or by using the keyword search tool below to find specific information within the annual report.-
 1
1 -
2
-
3
-
4
-
5
-
6
-
7
-
8
-
9
-
10
-
11
-
12
-
13
-
14
-
 15
15 -
 16
16 -
 17
17 -
 18
18 -
 19
19 -
 20
20 -
 21
21 -
 22
22 -
 23
23 -
 24
24 -
 25
25 -
 26
26 -
 27
27 -
 28
28 -
 29
29 -
 30
30 -
 31
31 -
 32
32 -
 33
33 -
 34
34 -
 35
35 -
36
-
37
-
38
-
39
-
40
-
41
-
42
-
43
-
44
-
45
-
46
-
47
-
48
-
49
-
50
-
51
-
52
-
53
-
54
-
55
-
56
-
57
-
58
-
59
-
60
-
61
-
62
-
63
-
64
-
65
-
66
-
67
-
68
-
69
-
70
-
71
-
72
-
73
-
74
-
75
-
76
-
77
-
78
-
79
-
80
-
81
-
82
-
83
-
84
-
85
-
86
-
87
-
88
-
89
-
90
-
91
 |
 |

25
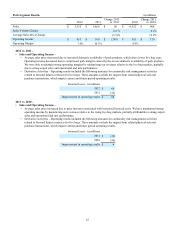
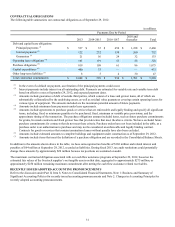
Pork Segment Results in millions
2012 2011 Change 2012
vs. 2011 2010 Change 2011
vs. 2010
Sales $ 5,510 $ 5,460 $ 50 $ 4,552 $ 908
Sales Volume Change 2.4 % 4.1%
Average Sales Price Change (1.5)% 15.2%
Operating Income $ 417 $ 560 $ (143) $ 381 $ 179
Operating Margin 7.6% 10.3% 8.4%
2012 vs. 2011 –
• Sales and Operating Income –
• Average sales price decreased due to increased domestic availability of pork products, which drove lower live hog costs.
Operating income decreased due to compressed pork margins caused by the excess domestic availability of pork products.
We were able to maintain strong operating margins by maximizing our revenues relative to the live hog markets, partially
due to strong export sales and operational and mix performance.
• Derivative Activities – Operating results included the following amounts for commodity risk management activities
related to forward futures contracts for live hogs. These amounts exclude the impact from related physical sale and
purchase transactions, which impact current and future period operating results.
Income/(Loss) – in millions
2012 $ 66
2011 (32)
Improvement in operating results $ 98
2011 vs. 2010 –
• Sales and Operating Income –
• Average sales price increased due to price increases associated with increased livestock costs. We have maintained strong
operating income by maximizing our revenues relative to the rising live hog markets, partially attributable to strong export
sales and operational and mix performance.
• Derivative Activities – Operating results included the following amounts for commodity risk management activities
related to forward futures contracts for live hogs. These amounts exclude the impact from related physical sale and
purchase transactions, which impact current and future period operating results.
Income/(Loss) – in millions
2011 $ (32)
2010 (36)
Improvement in operating results $ 4