Tyson Foods 2012 Annual Report Download - page 66
Download and view the complete annual report
Please find page 66 of the 2012 Tyson Foods annual report below. You can navigate through the pages in the report by either clicking on the pages listed below, or by using the keyword search tool below to find specific information within the annual report.-
 1
1 -
2
-
3
-
4
-
5
-
6
-
7
-
8
-
9
-
10
-
11
-
12
-
13
-
14
-
15
-
16
-
17
-
18
-
19
-
20
-
21
-
22
-
23
-
24
-
25
-
26
-
27
-
28
-
29
-
30
-
31
-
32
-
33
-
34
-
35
-
36
-
37
-
38
-
39
-
40
-
41
-
42
-
43
-
44
-
45
-
46
-
47
-
48
-
49
-
50
-
51
-
52
-
53
-
54
-
55
-
 56
56 -
 57
57 -
 58
58 -
 59
59 -
 60
60 -
 61
61 -
 62
62 -
 63
63 -
 64
64 -
 65
65 -
 66
66 -
 67
67 -
 68
68 -
 69
69 -
 70
70 -
 71
71 -
 72
72 -
 73
73 -
 74
74 -
 75
75 -
 76
76 -
77
-
78
-
79
-
80
-
81
-
82
-
83
-
84
-
85
-
86
-
87
-
88
-
89
-
90
-
91
 |
 |

66
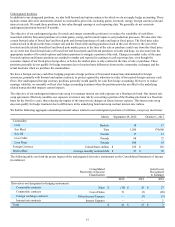
Plan Assets
The fair value of plan assets for domestic pension benefit plans was $69 million and $59 million as of September 29, 2012, and
October 1, 2011, respectively. The following table sets forth the actual and target asset allocation for pension plan assets:
2012 2011 Target Asset
Allocation
Cash 1.6% 1.9% 2.0%
Fixed Income Securities 46.0 24.2 38.0
US Stock Funds 23.5 41.4 22.5
International Stock Funds 23.5 17.7 22.5
Real Estate 5.0 4.7 5.0
Alternatives 0.4 10.1 10.0
Total 100.0% 100.0% 100.0%
A foreign subsidiary pension plan had $17 million and $15 million in plan assets at September 29, 2012, and October 1, 2011,
respectively. All of this plan’s assets are held in an insurance contract consistent with its target asset allocation.
The plan trustees have established a set of investment objectives related to the assets of the pension plans and regularly monitor the
performance of the funds and portfolio managers. Objectives for the pension assets are (i) to provide growth of capital and income,
(ii) to achieve a target weighted average annual rate of return competitive with other funds with similar investment objectives and
(iii) to diversify to reduce risk. The investment objectives and target asset allocation were adopted in January 2004 and amended in
August 2012. Alternative investments may include, but are not limited to, hedge funds, private equity funds and fixed income funds.
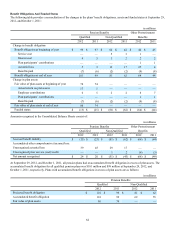
The following table shows the categories of pension plan assets and the level under which fair values were determined in the fair value
hierarchy, which is described in Note 12: Fair Value Measurements.
in millions
September 29, 2012
Level 1 Level 2 Level 3 Total
Cash and cash equivalents $ 1 $ — $ — $ 1
Fixed Income Securities Bond Fund (a) 32 — — 32
Equity Securities:
U.S. stock funds (a) 16 — — 16
International stock funds (a) 16 — — 16
Global real estate funds (a) 4 — — 4
Total equity securities 36 — — 36
Other Investments - Alternatives (b) ————
Total fair value 69 — — 69
Insurance Contract (b) — — 17 17
Total plan assets $ 69 $ — $ 17 $ 86
(a) Valued using quoted market prices in active markets.
(b) Valued using plan’s own assumptions about the assumptions market participants would use in pricing the assets based on the
best information available, such as investment manager pricing.