Tyson Foods 2012 Annual Report Download - page 21
Download and view the complete annual report
Please find page 21 of the 2012 Tyson Foods annual report below. You can navigate through the pages in the report by either clicking on the pages listed below, or by using the keyword search tool below to find specific information within the annual report.-
 1
1 -
2
-
3
-
4
-
5
-
6
-
7
-
8
-
9
-
10
-
 11
11 -
 12
12 -
 13
13 -
 14
14 -
 15
15 -
 16
16 -
 17
17 -
 18
18 -
 19
19 -
 20
20 -
 21
21 -
 22
22 -
 23
23 -
 24
24 -
 25
25 -
 26
26 -
 27
27 -
 28
28 -
 29
29 -
 30
30 -
 31
31 -
32
-
33
-
34
-
35
-
36
-
37
-
38
-
39
-
40
-
41
-
42
-
43
-
44
-
45
-
46
-
47
-
48
-
49
-
50
-
51
-
52
-
53
-
54
-
55
-
56
-
57
-
58
-
59
-
60
-
61
-
62
-
63
-
64
-
65
-
66
-
67
-
68
-
69
-
70
-
71
-
72
-
73
-
74
-
75
-
76
-
77
-
78
-
79
-
80
-
81
-
82
-
83
-
84
-
85
-
86
-
87
-
88
-
89
-
90
-
91
 |
 |

21
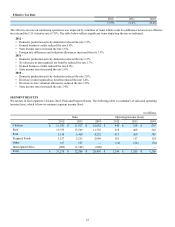
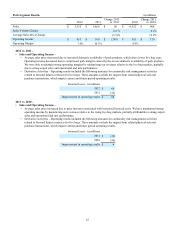
Selling, General and Administrative in millions
2012 2011 2010
Selling, general and administrative $ 912 $ 914 $ 929
As a percentage of sales 2.7% 2.8% 3.3%
2011 vs. 2010 –
• Decrease of $13 million related to reduced incentive-based compensation awarded during fiscal 2011.
Goodwill Impairment in millions
2012 2011 2010
$ — $ — $ 29
2010 – Included the full impairment of an immaterial Chicken segment reporting unit.
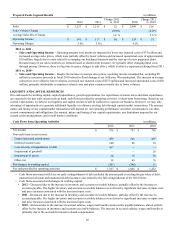
Interest Income in millions
2012 2011 2010
$ 12 $ 11 $ 14
2012/2011/2010 – Interest income remained at the current level primarily due to continued low interest rates.
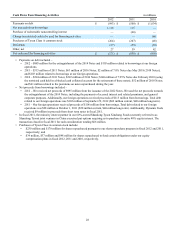
Interest Expense in millions
2012 2011 2010
Cash interest expense $ 151 $ 195 $ 245
Loss on early extinguishment of debt 167 — —
Losses on notes repurchased — 7 61
Non-cash interest expense 38 40 41
Total Interest Expense $ 356 $ 242 $ 347
2012/2011/2010 –
• Cash interest expense included interest expense related to the coupon rates for senior notes and commitment/letter of credit
fees incurred on our revolving credit facilities. The decrease is due primarily to lower average weekly indebtedness of
approximately 9% and 15% in fiscal 2012 and 2011, respectively. Additionally, the decrease in cash interest expense is due to
lower average coupon rates compared to fiscal 2011 and 2010.
• Loss on early extinguishment of debt included the amount paid exceeding the par value of debt, unamortized discount and
unamortized debt issuance costs related to the full extinguishment of the 10.50% Senior Notes due 2014 (2014 Notes).
• Losses on notes repurchased during fiscal 2011 and 2010 included the amount paid exceeding the carrying value of the notes
repurchased, which primarily included the repurchases of the 8.25% Notes due October 2011 (2011 Notes) and the 6.60%
Senior Notes due April 2016 (2016 Notes).
• Non-cash interest expense primarily included interest related to the amortization of debt issuance costs and discounts/
premiums on note issuances. This included debt issuance costs incurred on our revolving credit facility, the 2014 Notes, the
4.50% Senior Notes due 2022 (2022 Notes) issued in June 2012, as well as the accretion of the debt discount on the 3.25%
Convertible Senior Notes due 2013 (2013 Notes), 2014 Notes and 2022 Notes.
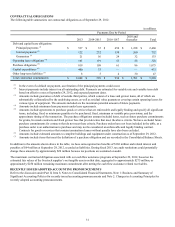
Other (Income) Expense, net in millions
2012 2011 2010
$(23) $ (20) $ 20
2012 – Included $16 million of equity earnings in joint ventures and $4 million in net foreign currency exchange gains.
2011 – Included $11 million gain related to a sale of interests in an equity method investment.
2010 – Included $12 million charge related to the impairment of an equity method investment.