Tyson Foods 2012 Annual Report Download - page 65
Download and view the complete annual report
Please find page 65 of the 2012 Tyson Foods annual report below. You can navigate through the pages in the report by either clicking on the pages listed below, or by using the keyword search tool below to find specific information within the annual report.-
 1
1 -
2
-
3
-
4
-
5
-
6
-
7
-
8
-
9
-
10
-
11
-
12
-
13
-
14
-
15
-
16
-
17
-
18
-
19
-
20
-
21
-
22
-
23
-
24
-
25
-
26
-
27
-
28
-
29
-
30
-
31
-
32
-
33
-
34
-
35
-
36
-
37
-
38
-
39
-
40
-
41
-
42
-
43
-
44
-
45
-
46
-
47
-
48
-
49
-
50
-
51
-
52
-
53
-
54
-
 55
55 -
 56
56 -
 57
57 -
 58
58 -
 59
59 -
 60
60 -
 61
61 -
 62
62 -
 63
63 -
 64
64 -
 65
65 -
 66
66 -
 67
67 -
 68
68 -
 69
69 -
 70
70 -
 71
71 -
 72
72 -
 73
73 -
 74
74 -
 75
75 -
76
-
77
-
78
-
79
-
80
-
81
-
82
-
83
-
84
-
85
-
86
-
87
-
88
-
89
-
90
-
91
 |
 |

65
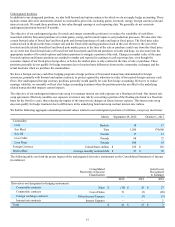
Net Periodic Benefit Cost
Components of net periodic benefit cost for pension and postretirement benefit plans recognized in the Consolidated Statements of
Income are as follows:
in millions
Pension Benefits Other Postretirement
Qualified Non-Qualified Benefits
2012 2011 2010 2012 2011 2010 2012 2011 2010
Service cost $ — $ — $ — $ 5 $ 3 $ 3 $ 1 $ — $ 1
Interest cost 455322222
Expected return on plan assets (6) (6) (6) — — — — — —
Amortization of prior service cost — — — 1 1 1 (1)(1)(1)
Recognized actuarial loss, net 3 3 1 1 — — 24 1 —
Net periodic benefit cost $ 1 $ 2 $ — $ 10 $ 6 $ 6 $ 26 $ 2 $ 2
As of September 29, 2012, the amounts expected to be reclassified into earnings within the next 12 months related to net periodic
benefit cost for the qualified and non-qualified pensions are $3 million and $3 million, respectively.
Assumptions
Weighted average assumptions are as follows:
Pension Benefits Other Postretirement
Qualified Non-Qualified Benefits
2012 2011 2010 2012 2011 2010 2012 2011 2010
Discount rate to determine net
periodic benefit cost 4.53% 5.06% 6.00% 4.75% 5.50% 6.00% 4.09% 4.50% 5.71%
Discount rate to determine
benefit obligations 4.02% 4.53% 5.06% 4.23% 4.75% 5.50% 3.66% 4.09% 4.50%
Rate of compensation increase N/A N/A N/A 3.50% 3.50% 3.50% N/A N/A N/A
Expected return on plan assets 6.37% 7.79% 7.80% N/A N/A N/A N/A N/A N/A
To determine the expected return on plan assets assumption, we first examined historical rates of return for the various asset classes.
We then determined a long-term projected rate-of-return based on expected returns over the next five to 10 years.
Our discount rate assumptions used to account for pension and other postretirement benefit plans reflect the rates at which the benefit
obligations could be effectively settled. These were determined using a cash flow matching technique whereby the rates of a yield
curve, developed from high-quality debt securities, were applied to the benefit obligations to determine the appropriate discount rate.
We have three other postretirement benefit plans which are all healthcare related. Two of these plans, which benefit obligations totaled
$26 million at September 29, 2012, were not impacted by healthcare cost trend rates as they consist of fixed annual payments. The
remaining plan, which benefit obligation was $38 million at September 29, 2012, covers retirees who do not yet qualify for Medicare
and utilized an assumed healthcare cost trend rate of 8%. A one-percentage point change in assumed healthcare cost trend rate would
have an approximate $4 million impact on the postretirement benefit obligation.