Tyson Foods 2012 Annual Report Download - page 23
Download and view the complete annual report
Please find page 23 of the 2012 Tyson Foods annual report below. You can navigate through the pages in the report by either clicking on the pages listed below, or by using the keyword search tool below to find specific information within the annual report.-
 1
1 -
2
-
3
-
4
-
5
-
6
-
7
-
8
-
9
-
10
-
11
-
12
-
 13
13 -
 14
14 -
 15
15 -
 16
16 -
 17
17 -
 18
18 -
 19
19 -
 20
20 -
 21
21 -
 22
22 -
 23
23 -
 24
24 -
 25
25 -
 26
26 -
 27
27 -
 28
28 -
 29
29 -
 30
30 -
 31
31 -
 32
32 -
 33
33 -
34
-
35
-
36
-
37
-
38
-
39
-
40
-
41
-
42
-
43
-
44
-
45
-
46
-
47
-
48
-
49
-
50
-
51
-
52
-
53
-
54
-
55
-
56
-
57
-
58
-
59
-
60
-
61
-
62
-
63
-
64
-
65
-
66
-
67
-
68
-
69
-
70
-
71
-
72
-
73
-
74
-
75
-
76
-
77
-
78
-
79
-
80
-
81
-
82
-
83
-
84
-
85
-
86
-
87
-
88
-
89
-
90
-
91
 |
 |

23
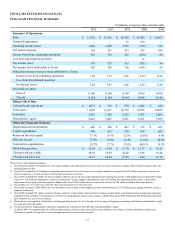
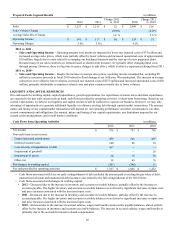
Chicken Segment Results in millions
2012 2011 Change 2012
vs. 2011 2010 Change 2011
vs. 2010
Sales $ 11,591 $ 11,017 $ 574 $ 10,062 $ 955
Sales Volume Change (3.6)% 4.6%
Average Sales Price Change 9.2 % 4.7%
Operating Income $ 446 $ 164 $ 282 $ 519 $ (355)
Operating Margin 3.8% 1.5% 5.2%
2012 – Operating income included a $15 million non-cash charge related to the impairment of non-core assets in China.
2010 – Operating income included a $38 million gain from insurance proceeds and a $29 million non-cash, non-tax deductible
charge related to a full goodwill impairment of an immaterial Chicken segment reporting unit.
2012 vs. 2011 –
• Sales Volume – The decrease in sales volumes in fiscal 2012 was primarily attributable to the impact of domestic production
cuts we made in late fiscal 2011 and maintained throughout fiscal 2012, in order to balance our supply with forecasted
customer demand. These production cuts reduced our total domestic slaughter pounds by approximately 4% in fiscal 2012, but
were partially offset by increases in international sales volumes and open-market meat purchases.
• Average Sales Price – The increase in average sales prices is primarily due to mix changes and price increases associated with
reduced industry supply and increased input costs.
• Operating Income – The increase in operating income was largely due to the increase in average sales price and operational
improvements, partially offset by reduced sales volumes, increased grain, feed ingredients and other growout costs and losses
incurred in our foreign start-up businesses.
• Grain, Feed Ingredients and Growout Costs – Operating results were negatively impacted in fiscal 2012 by an increase in
grain and feed ingredients costs of $320 million and an increase in other growout operating costs of $50 million.
• Operational Improvements – Operating results were positively impacted by approximately $115 million of operational
improvements, primarily attributed to improvements in yield, mix and processing optimization.
• Start-up Businesses – Our foreign start-up businesses in Brazil and China incurred operating losses of approximately $105
million in fiscal 2012, which included $15 million for the impairment of non-core assets.
• Derivative Activities – Operating results included the following amounts for commodity risk management activities
related to grain and energy purchases. These amounts exclude the impact from related physical purchase transactions,
which impact current and future period operating results.
Income/(Loss) – in millions
2012 $ (25)
2011 41
Decline in operating results $ (66)
2011 vs. 2010 –
• Sales Volume – A 2.1% increase in slaughter pounds that mostly occurred in the first three quarters of fiscal 2011 and a
reduction of volumes in ending inventory in fiscal 2011 as compared to fiscal 2010, primarily drove the 4.6% increase in sales
volume for fiscal 2011.
• Average Sales Price – The increase in average sales prices is primarily due to mix changes and price increases associated with
increased input costs.
• Operating Income –
• Grain, Feed Ingredients and Growout Costs – Operating results were negatively impacted in fiscal 2011 by an increase in
grain and feed ingredients costs of $675 million and an increase in other growout operating costs of $74 million.
• Operational Improvements – Operating results were positively impacted by approximately $200 million of operational
improvements, primarily attributed to improvements in yield, mix and processing optimization. These operational
improvements were partially offset by an increase in operating costs, mostly from cooking ingredients and employee
related costs.
• Derivative Activities – Operating results included the following amounts for commodity risk management activities
related to grain and energy purchases. These amounts exclude the impact from related physical purchase transactions,
which impact current and future period operating results.
Income/(Loss) – in millions
2011 $ 41
2010 (6)
Improvement in operating results $ 47