Tyson Foods 2012 Annual Report Download - page 18
Download and view the complete annual report
Please find page 18 of the 2012 Tyson Foods annual report below. You can navigate through the pages in the report by either clicking on the pages listed below, or by using the keyword search tool below to find specific information within the annual report.-
 1
1 -
2
-
3
-
4
-
5
-
6
-
7
-
 8
8 -
 9
9 -
 10
10 -
 11
11 -
 12
12 -
 13
13 -
 14
14 -
 15
15 -
 16
16 -
 17
17 -
 18
18 -
 19
19 -
 20
20 -
 21
21 -
 22
22 -
 23
23 -
 24
24 -
 25
25 -
 26
26 -
 27
27 -
 28
28 -
29
-
30
-
31
-
32
-
33
-
34
-
35
-
36
-
37
-
38
-
39
-
40
-
41
-
42
-
43
-
44
-
45
-
46
-
47
-
48
-
49
-
50
-
51
-
52
-
53
-
54
-
55
-
56
-
57
-
58
-
59
-
60
-
61
-
62
-
63
-
64
-
65
-
66
-
67
-
68
-
69
-
70
-
71
-
72
-
73
-
74
-
75
-
76
-
77
-
78
-
79
-
80
-
81
-
82
-
83
-
84
-
85
-
86
-
87
-
88
-
89
-
90
-
91
 |
 |

18
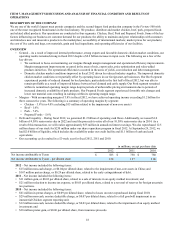
ITEM 7. MANAGEMENT’S DISCUSSION AND ANALYSIS OF FINANCIAL CONDITION AND RESULTS OF
OPERATIONS
DESCRIPTION OF THE COMPANY
We are one of the world’s largest meat protein companies and the second-largest food production company in the Fortune 500 with
one of the most recognized brand names in the food industry. We produce, distribute and market chicken, beef, pork, prepared foods
and related allied products. Our operations are conducted in four segments: Chicken, Beef, Pork and Prepared Foods. Some of the key
factors influencing our business are customer demand for our products; the ability to maintain and grow relationships with customers
and introduce new and innovative products to the marketplace; accessibility of international markets; market prices for our products;
the cost of live cattle and hogs, raw materials, grain and feed ingredients; and operating efficiencies of our facilities.
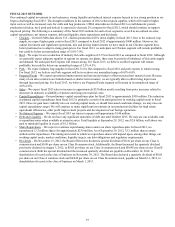
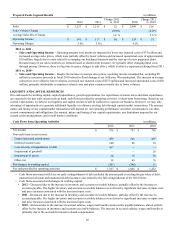
OVERVIEW
• General – As a result of improved internal performance, strong exports and favorable domestic chicken market conditions, our
operating results remained strong in fiscal 2012 despite a $2.2 billion increase in input costs. The following are a few of the
key drivers:
• We continued to focus on maximizing our margins through margin management and operational efficiency improvements.
Margin management improvements occurred in the areas of mix, export sales, price optimization and value-added
products initiatives. The operational efficiencies occurred in the areas of yields, cost reduction and labor management.
• Domestic chicken market conditions improved in fiscal 2012 driven by reduced industry supplies. The improved domestic
chicken market conditions were partially offset by operating losses in our foreign start-up businesses. Our Beef segment
experienced periods of reduced demand for beef products, particularly in the first half of fiscal 2012, but was able to
remain profitable as a result of improved balance between beef demand and cattle supply. Our Pork segment remained
within its normalized operating margin range despite periods of unfavorable pricing environments due to periods of
increased domestic availability of pork products. Our Prepared Foods segment experienced favorable mix changes and
lower raw material costs resulting in earnings within its operating margin range.
• Margins – With an operating margin of 3.8% in fiscal 2012, we have achieved operating income exceeding $1.2 billion for
three consecutive years. The following is a summary of operating margins by segment:
• Chicken – 3.8% (or 4.0% excluding $15 million related to the impairment of non-core assets)
• Beef – 1.6%
• Pork – 7.6%
• Prepared Foods – 5.6%
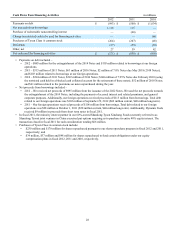
• Debt and Liquidity – During fiscal 2012, we generated $1.2 billion of operating cash flows. Additionally, we issued $1.0
billion of 4.50% senior notes due in 2022 and used the proceeds to retire all of our 10.50% senior notes due in 2014. As a
result of this transaction, we will realize approximately $55 million in annualized interest savings. We also repurchased 12.5
million shares of our stock for $230 million under our share repurchase program in fiscal 2012. At September 29, 2012, we
had $2.0 billion of liquidity, which includes the availability under our credit facility and $1.1 billion of cash and cash
equivalents.
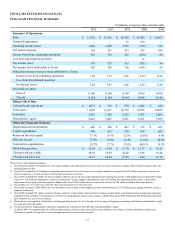
• Our accounting cycle resulted in a 52-week year for fiscal 2012, 2011 and 2010.
in millions, except per share data
2012 2011 2010
Net income attributable to Tyson $ 583 $ 750 $ 780
Net income attributable to Tyson – per diluted share 1.58 1.97 2.06
2012 – Net income included the following items:
• $15 million non-cash charge, or $0.04 per diluted share, related to the impairment of non-core assets in China; and
• $167 million pretax charge, or $0.29 per diluted share, related to the early extinguishment of debt.
2011 – Net income included the following items:
• $11 million gain, or $0.03 per diluted share, related to a sale of interests in an equity method investment; and
• $21 million reduction to income tax expense, or $0.05 per diluted share, related to a reversal of reserves for foreign uncertain
tax positions.
2010 – Net income included the following items:
• $61 million in pretax charges, or $0.09 per diluted share, related to losses on notes repurchased during fiscal 2010;
• $29 million non-cash, non-tax deductible charge, or $0.07 per diluted share, related to a full goodwill impairment in an
immaterial Chicken segment reporting unit;
• $12 million non-cash, non-tax deductible charge, or $0.03 per diluted share, related to the impairment of an equity method
investment; and
• $38 million pretax gain, or $0.06 per diluted share, from insurance proceeds.