Tyson Foods 2012 Annual Report Download - page 24
Download and view the complete annual report
Please find page 24 of the 2012 Tyson Foods annual report below. You can navigate through the pages in the report by either clicking on the pages listed below, or by using the keyword search tool below to find specific information within the annual report.-
 1
1 -
2
-
3
-
4
-
5
-
6
-
7
-
8
-
9
-
10
-
11
-
12
-
13
-
 14
14 -
 15
15 -
 16
16 -
 17
17 -
 18
18 -
 19
19 -
 20
20 -
 21
21 -
 22
22 -
 23
23 -
 24
24 -
 25
25 -
 26
26 -
 27
27 -
 28
28 -
 29
29 -
 30
30 -
 31
31 -
 32
32 -
 33
33 -
 34
34 -
35
-
36
-
37
-
38
-
39
-
40
-
41
-
42
-
43
-
44
-
45
-
46
-
47
-
48
-
49
-
50
-
51
-
52
-
53
-
54
-
55
-
56
-
57
-
58
-
59
-
60
-
61
-
62
-
63
-
64
-
65
-
66
-
67
-
68
-
69
-
70
-
71
-
72
-
73
-
74
-
75
-
76
-
77
-
78
-
79
-
80
-
81
-
82
-
83
-
84
-
85
-
86
-
87
-
88
-
89
-
90
-
91
 |
 |

24
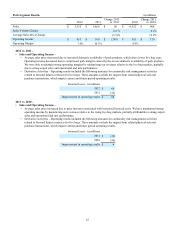
Beef Segment Results in millions
2012 2011 Change 2012
vs. 2011 2010 Change 2011
vs. 2010
Sales $ 13,755 $ 13,549 $ 206 $ 11,707 $ 1,842
Sales Volume Change (11.3)% (1.0)%
Average Sales Price Change 14.4 % 16.9 %
Operating Income $ 218 $ 468 $ (250) $ 542 $ (74)
Operating Margin 1.6% 3.5% 4.6%
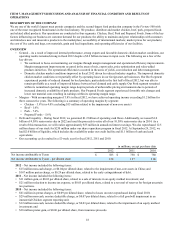
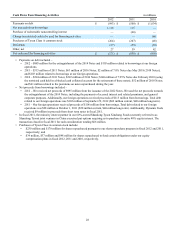
2012 vs. 2011 –
• Sales and Operating Income –
• Average sales price increased due to price increases associated with increased livestock costs. Sales volume decreased due
to a reduction in live cattle processed and outside tallow purchases. Operating income decreased due to higher fed cattle
costs and periods of reduced demand for beef products, which made it difficult to pass along increased input costs, as well
as lower sales volumes and increased employee related operating costs.
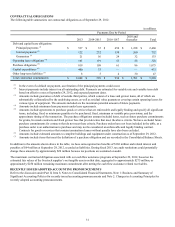
• Derivative Activities – Operating results included the following amounts for commodity risk management activities
related to forward futures contracts for live cattle. These amounts exclude the impact from related physical sale and
purchase transactions, which impact current and future period operating results.
Income/(Loss) – in millions
2012 $ 31
2011 (41)
Improvement in operating results $ 72
2011 vs. 2010 –
• Sales and Operating Income –
• Average sales price increased due to price increases associated with increased livestock costs. We have maintained strong
operating income by maximizing our revenues relative to the rising live cattle markets, partially attributable to strong
export sales. This was offset by an increase in operating costs, primarily attributable to employee related costs.
• Derivative Activities – Operating results included the following amounts for commodity risk management activities
related to forward futures contracts for live cattle. These amounts exclude the impact from related physical sale and
purchase transactions, which impact current and future period operating results.
Income/(Loss) – in millions
2011 $ (41)
2010 (15)
Decline in operating results $ (26)