Tyson Foods 2012 Annual Report Download - page 20
Download and view the complete annual report
Please find page 20 of the 2012 Tyson Foods annual report below. You can navigate through the pages in the report by either clicking on the pages listed below, or by using the keyword search tool below to find specific information within the annual report.-
 1
1 -
2
-
3
-
4
-
5
-
6
-
7
-
8
-
9
-
 10
10 -
 11
11 -
 12
12 -
 13
13 -
 14
14 -
 15
15 -
 16
16 -
 17
17 -
 18
18 -
 19
19 -
 20
20 -
 21
21 -
 22
22 -
 23
23 -
 24
24 -
 25
25 -
 26
26 -
 27
27 -
 28
28 -
 29
29 -
 30
30 -
31
-
32
-
33
-
34
-
35
-
36
-
37
-
38
-
39
-
40
-
41
-
42
-
43
-
44
-
45
-
46
-
47
-
48
-
49
-
50
-
51
-
52
-
53
-
54
-
55
-
56
-
57
-
58
-
59
-
60
-
61
-
62
-
63
-
64
-
65
-
66
-
67
-
68
-
69
-
70
-
71
-
72
-
73
-
74
-
75
-
76
-
77
-
78
-
79
-
80
-
81
-
82
-
83
-
84
-
85
-
86
-
87
-
88
-
89
-
90
-
91
 |
 |

20
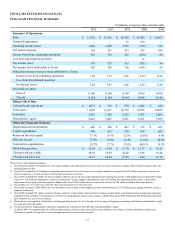
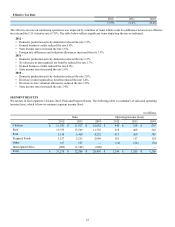
SUMMARY OF RESULTS
Sales in millions
2012 2011 2010
Sales $ 33,278 $ 32,266 $ 28,430
Change in sales volume (4.3)% 1.7%
Change in average sales price 7.7 % 11.8%
Sales growth 3.1 % 13.5%
2012 vs. 2011 –
• Average Sales Price – The increase in sales was largely due to an increase in average sales prices, which accounted for an
increase of approximately $2.7 billion. All segments, with the exception of the Pork segment, had an increase in average sales
prices largely due to continued tight domestic availability of protein and increased live and raw material costs. These increases
were partially offset by a decrease in average sales price in the Pork segment which was driven down by lower live hog costs.
• Sales Volume – Sales were negatively impacted by a decrease in sales volume, which accounted for a decrease of $1.7 billion.
All segments, with the exception of the Pork segment, had a decrease in sales volume, with the majority of the decrease in the
Beef segment.
2011 vs. 2010 –
• Average Sales Price – The increase in sales was largely due to an increase in average sales prices, which accounted for an
increase of approximately $3.4 billion. While all segments had an increase in average sales prices mostly due to price
increases associated with rising raw material costs, the majority of the increase was driven by the Beef and Pork segments.
• Sales Volume – Sales were positively impacted by an increase in sales volume, which accounted for an increase of $484
million. This was primarily due to increases in the Chicken and Pork segments, partially offset by decreases in the Beef and
Prepared Foods segments.
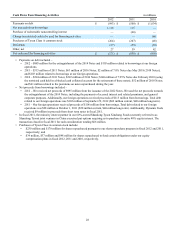
Cost of Sales in millions
2012 2011 2010
Cost of sales $ 31,118 $ 30,067 $ 25,916
Gross profit $ 2,160 $ 2,199 $ 2,514
Cost of sales as a percentage of sales 93.5% 93.2% 91.2%
2012 vs. 2011 –
• Cost of sales increased by approximately $1.0 billion. Higher input cost per pound increased cost of sales by approximately
$2.2 billion, while lower sales volume decreased cost of sales $1.2 billion.
• The $2.2 billion impact of higher input costs per pound was primarily driven by:
• Increase in live cattle and hog costs of approximately $1.5 billion.
• Increase in grain and feed ingredients of $320 million and increase in other growout operating costs of $50 million in
our Chicken segment.
• The $1.2 billion impact of lower sales volumes was driven by decreases in our Chicken, Beef and Prepared Foods
segments, partially offset by an increase in sales volume in our Pork segment.
2011 vs. 2010 –
• Cost of sales increased by approximately $4.1 billion. Higher input cost per pound increased cost of sales by approximately
$3.7 billion, while higher sales volume increased cost of sales $445 million.
• The $3.7 billion impact of higher input costs per pound was primarily driven by:
• Increase in live cattle and hog costs of approximately $2.4 billion.
• Increase in grain and feed ingredients of $675 million and increase in other growout operating costs of $74 million in
our Chicken segment, which were partially offset by approximately $200 million of operational improvements.
• Increase in raw material costs of $273 million in our Prepared Foods segment.
• The $0.4 billion impact of higher sales volumes was primarily driven by:
• Increases in sales volume in our Chicken and Pork segments partially offset by decreases in our Beef and Prepared
Foods segments.
• Increase of $145 million of costs of sales associated with Dynamic Fuels, which commenced production activities in
fiscal 2011.