Tyson Foods 2012 Annual Report Download - page 26
Download and view the complete annual report
Please find page 26 of the 2012 Tyson Foods annual report below. You can navigate through the pages in the report by either clicking on the pages listed below, or by using the keyword search tool below to find specific information within the annual report.-
 1
1 -
2
-
3
-
4
-
5
-
6
-
7
-
8
-
9
-
10
-
11
-
12
-
13
-
14
-
15
-
 16
16 -
 17
17 -
 18
18 -
 19
19 -
 20
20 -
 21
21 -
 22
22 -
 23
23 -
 24
24 -
 25
25 -
 26
26 -
 27
27 -
 28
28 -
 29
29 -
 30
30 -
 31
31 -
 32
32 -
 33
33 -
 34
34 -
 35
35 -
 36
36 -
37
-
38
-
39
-
40
-
41
-
42
-
43
-
44
-
45
-
46
-
47
-
48
-
49
-
50
-
51
-
52
-
53
-
54
-
55
-
56
-
57
-
58
-
59
-
60
-
61
-
62
-
63
-
64
-
65
-
66
-
67
-
68
-
69
-
70
-
71
-
72
-
73
-
74
-
75
-
76
-
77
-
78
-
79
-
80
-
81
-
82
-
83
-
84
-
85
-
86
-
87
-
88
-
89
-
90
-
91
 |
 |

26
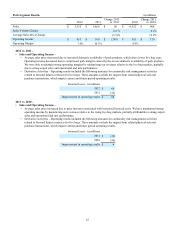
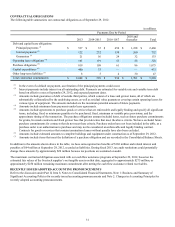
Prepared Foods Segment Results in millions
2012 2011 Change 2012
vs. 2011 2010 Change 2011
vs. 2010
Sales $ 3,237 $ 3,215 $ 22 $ 2,999 $ 216
Sales Volume Change (0.9)% (2.2)%
Average Sales Price Change 1.6 % 9.6 %
Operating Income $ 181 $ 117 $ 64 $ 124 $ (7)
Operating Margin 5.6% 3.6% 4.1%
2012 vs. 2011 –
• Sales and Operating Income – Operating margins were positively impacted by lower raw material costs of $75 million and
increased average sales prices, which were partially offset by lower volumes and increased operational costs of approximately
$30 million, largely due to costs related to revamping our lunchmeat business and the start-up of a new pepperoni plant.
Because many of our sales contracts are formula based or shorter-term in nature, we typically offset changing input costs
through pricing. However, there is a lag time for price changes to take effect, which is what we experienced during fiscal 2011.
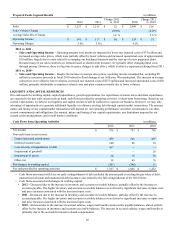
2011 vs. 2010 –
• Sales and Operating Income – Despite the increase in average sales prices, operating income remained flat, excluding $8
million in insurance proceeds in fiscal 2010 related to flood damage at our Jefferson, Wisconsin plant. The increase in average
sales prices were offset by lower volumes, increased raw material costs of $273 million and increased operational costs of $50
million, primarily attributable to employee related costs and plant variances mostly due to lower volumes.
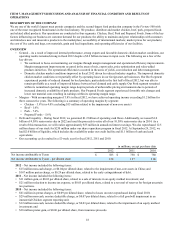
LIQUIDITY AND CAPITAL RESOURCES
Our cash needs for working capital, capital expenditures, growth opportunities, the repurchases of senior notes and share repurchases
are expected to be met with current cash on hand, cash flows provided by operating activities, or short-term borrowings. Based on our
current expectations, we believe our liquidity and capital resources will be sufficient to operate our business. However, we may take
advantage of opportunities to generate additional liquidity or refinance existing debt through capital market transactions. The amount,
nature and timing of any capital market transactions will depend on: our operating performance and other circumstances; our then-
current commitments and obligations; the amount, nature and timing of our capital requirements; any limitations imposed by our
current credit arrangements; and overall market conditions.
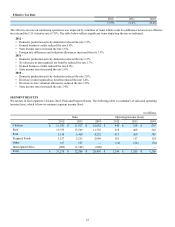
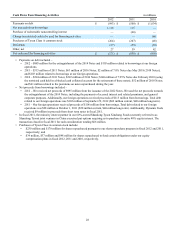
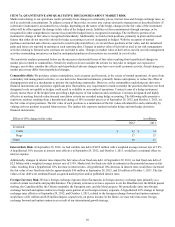
Cash Flows from Operating Activities in millions
2012 2011 2010
Net income $ 576 $ 733 $ 765
Non-cash items in net income:
Depreciation and amortization 499 506 497
Deferred income taxes 140 86 18
Loss on early extinguishment of debt 167 — —
Impairment of goodwill — — 29
Impairment of assets 34 18 36
Other, net 18 49 76
Net changes in working capital (247)(346) 11
Net cash provided by operating activities $ 1,187 $ 1,046 $ 1,432
• Cash flows associated with Loss on early extinguishment of debt included the amount paid exceeding the par value of debt,
unamortized discount and unamortized debt issuance costs related to the full extinguishment of the 2014 Notes.
• Cash flows associated with changes in working capital:
• 2012 – Decreased due to the increase in inventory and accounts receivable balances, partially offset by the increase in
accounts payable. The higher inventory and accounts receivable balances were driven by significant increases in input costs
and price increases associated with the increased input costs.
• 2011 – Decreased due to the increase in inventory and accounts receivable balances, partially offset by the increase in
accounts payable. The higher inventory and accounts receivable balances were driven by significant increases in input costs
and price increases associated with the increased input costs.
• 2010 – Increased due to the increase in accrued salaries, wages and benefits and accounts payable balances, almost entirely
offset by the increase in inventory and accounts receivable balances. The increase in accrued salaries, wages and benefits is
primarily due to the accruals for incentive-based compensation.