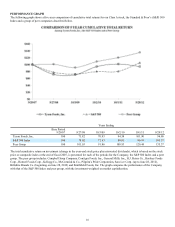
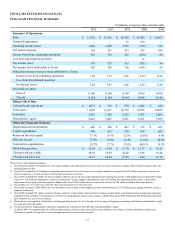
Tyson Foods 2012 Annual Report Download - page 12
Download and view the complete annual report
Please find page 12 of the 2012 Tyson Foods annual report below. You can navigate through the pages in the report by either clicking on the pages listed below, or by using the keyword search tool below to find specific information within the annual report.-
 1
1 -
 2
2 -
 3
3 -
 4
4 -
 5
5 -
 6
6 -
 7
7 -
 8
8 -
 9
9 -
 10
10 -
 11
11 -
 12
12 -
 13
13 -
 14
14 -
 15
15 -
 16
16 -
 17
17 -
 18
18 -
 19
19 -
 20
20 -
 21
21 -
 22
22 -
23
-
24
-
25
-
26
-
27
-
28
-
29
-
30
-
31
-
32
-
33
-
34
-
35
-
36
-
37
-
38
-
39
-
40
-
41
-
42
-
43
-
44
-
45
-
46
-
47
-
48
-
49
-
50
-
51
-
52
-
53
-
54
-
55
-
56
-
57
-
58
-
59
-
60
-
61
-
62
-
63
-
64
-
65
-
66
-
67
-
68
-
69
-
70
-
71
-
72
-
73
-
74
-
75
-
76
-
77
-
78
-
79
-
80
-
81
-
82
-
83
-
84
-
85
-
86
-
87
-
88
-
89
-
90
-
91
 |
 |
12
Tyson Limited Partnership can exercise significant control.
As of September 29, 2012, Tyson Limited Partnership (the TLP) owns 99.977% of the outstanding shares of the Company's Class B
Common Stock, $0.10 par value (Class B stock) and the TLP and members of the Tyson family own, in the aggregate, 2.53% of the
outstanding shares of the Company's Class A Common Stock, $0.10 par value (Class A stock), giving them, collectively, control of
approximately 71.52% of the total voting power of the Company's outstanding voting stock. At this time, the TLP does not have a
managing general partner, as such, the management rights of the managing general partner may be exercised by a majority of the
percentage interests of the general partners. As of September 29, 2012, Mr. John Tyson, Chairman of the Board of Directors, has
33.33% of the general partner percentage interests, and Ms. Barbara Tyson, a director of the Company, has 11.115% general partner
percentage interests (the remaining general partnership interests are held by the Tyson Partnership Interest Trust (44.44%) and Harry
C. Erwin, III (11.115%)). As a result of these holdings, positions and directorships, the partners in the TLP have the ability to exert
substantial influence or actual control over our management and affairs and over substantially all matters requiring action by our
stockholders, including amendments to our restated certificate of incorporation and by-laws, the election and removal of directors, any
proposed merger, consolidation or sale of all or substantially all of our assets and other corporate transactions. This concentration of
ownership may also delay or prevent a change in control otherwise favored by our other stockholders and could depress our stock
price. Additionally, as a result of the Tyson family’s significant ownership of our outstanding voting stock, we are eligible for
“controlled company” exemptions from certain corporate governance requirements of the New York Stock Exchange.
ITEM 1B. UNRESOLVED STAFF COMMENTS
None
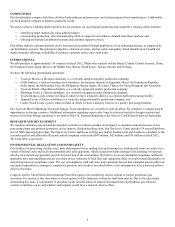
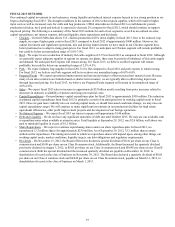
ITEM 2. PROPERTIES
We have production and distribution operations in the following states: Alabama, Arkansas, Georgia, Illinois, Indiana, Iowa, Kansas,
Kentucky, Mississippi, Missouri, Nebraska, New Mexico, New York, North Carolina, Oklahoma, Pennsylvania, South Carolina,
Tennessee, Texas, Virginia, Washington and Wisconsin. We also have sales offices throughout the United States. Additionally, we,
either directly or through our subsidiaries, have sales offices, facilities or participate in joint venture operations in Argentina, Brazil,
Canada, China, the Dominican Republic, Hong Kong, India, Japan, Mexico, the Netherlands, Peru, the Philippines, Russia, South
Korea, Spain, Sri Lanka, Taiwan, Thailand, the United Arab Emirates, the United Kingdom and Venezuela.
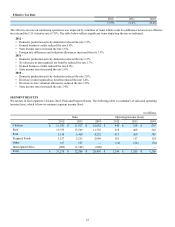
Number of Facilities
Owned Leased Total
Chicken Segment:
Processing plants 59 1 60
Rendering plants 15 — 15
Blending mills 2 — 2
Feed mills 39 2 41
Broiler hatcheries 63 9 72
Breeder houses 593 760 1,353
Broiler farm houses 758 1,089 1,847
Beef Segment Production Facilities 12 — 12
Pork Segment Production Facilities 9 — 9
Prepared Foods Segment Processing Plants 22 1 23
Distribution Centers 10 7 17
Cold Storage Facilities 67 14 81
Capacity(1)
per week at
September 29, 2012
Fiscal 2012
Average Capacity
Utilization
Chicken Processing Plants 47 million head 88%
Beef Production Facilities 174,000 head 76%
Pork Production Facilities 448,000 head 90%
Prepared Foods Processing Plants 46 million pounds 85%
(1) Capacity based on a five day week for Chicken and Prepared Foods, while Beef and Pork are based on a six day week.