Tyson Foods 2012 Annual Report Download - page 77
Download and view the complete annual report
Please find page 77 of the 2012 Tyson Foods annual report below. You can navigate through the pages in the report by either clicking on the pages listed below, or by using the keyword search tool below to find specific information within the annual report.-
 1
1 -
2
-
3
-
4
-
5
-
6
-
7
-
8
-
9
-
10
-
11
-
12
-
13
-
14
-
15
-
16
-
17
-
18
-
19
-
20
-
21
-
22
-
23
-
24
-
25
-
26
-
27
-
28
-
29
-
30
-
31
-
32
-
33
-
34
-
35
-
36
-
37
-
38
-
39
-
40
-
41
-
42
-
43
-
44
-
45
-
46
-
47
-
48
-
49
-
50
-
51
-
52
-
53
-
54
-
55
-
56
-
57
-
58
-
59
-
60
-
61
-
62
-
63
-
64
-
65
-
66
-
 67
67 -
 68
68 -
 69
69 -
 70
70 -
 71
71 -
 72
72 -
 73
73 -
 74
74 -
 75
75 -
 76
76 -
 77
77 -
 78
78 -
 79
79 -
 80
80 -
 81
81 -
 82
82 -
 83
83 -
 84
84 -
 85
85 -
 86
86 -
 87
87 -
88
-
89
-
90
-
91
 |
 |
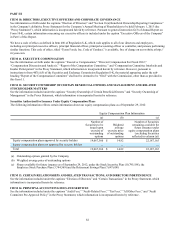
77
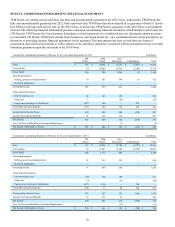
Condensed Consolidating Statement of Income for the year ended October 2, 2010 in millions
TFI
Parent TFM
Parent Non-
Guarantors Eliminations Total
Sales $ 454 $ 15,950 $ 13,415 $ (1,389) $ 28,430
Cost of Sales 16 14,867 12,422 (1,389) 25,916
Gross Profit 438 1,083 993 — 2,514
Operating Expenses:
Selling, general and administrative 93 199 637 — 929
Goodwill impairment ——29—29
Operating Income 345 884 327 — 1,556
Other (Income) Expense:
Interest expense, net 328 2 3 — 333
Other, net 25 1 (6) — 20
Equity in net earnings of subsidiaries (782) (51) — 833 —
Total Other (Income) Expense (429) (48) (3) 833 353
Income before Income Taxes 774 932 330 (833) 1,203
Income Tax Expense (Benefit) (6) 304 140 — 438
Net Income 780 628 190 (833) 765
Less: Net Loss Attributable to Noncontrolling Interest — — (15) — (15)
Net Income Attributable to Tyson $ 780 $ 628 $ 205 $ (833) $ 780
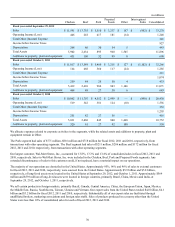
Condensed Consolidating Balance Sheet as of September 29, 2012 in millions
TFI
Parent TFM
Parent Non-
Guarantors Eliminations Total
Assets
Current Assets:
Cash and cash equivalents $ 1 $ 9 $ 1,061 $ — $ 1,071
Accounts receivable, net 1 499 878 — 1,378
Inventories — 950 1,859 — 2,809
Other current assets 139 100 90 (184) 145
Total Current Assets 141 1,558 3,888 (184) 5,403
Net Property, Plant and Equipment 31 873 3,118 — 4,022
Goodwill — 881 1,010 — 1,891
Intangible Assets — 26 103 — 129
Other Assets 1,257 151 251 (1,208) 451
Investment in Subsidiaries 11,849 2,005 — (13,854) —
Total Assets $ 13,278 $ 5,494 $ 8,370 $ (15,246) $ 11,896
Liabilities and Shareholders’ Equity
Current Liabilities:
Current debt $ 439 $ — $ 167 $ (91) $ 515
Accounts payable 10 558 804 — 1,372
Other current liabilities 4,887 144 766 (4,854) 943
Total Current Liabilities 5,336 702 1,737 (4,945) 2,830
Long-Term Debt 1,774 809 486 (1,152) 1,917
Deferred Income Taxes — 135 432 (9) 558
Other Liabilities 156 146 294 (47) 549
Total Tyson Shareholders’ Equity 6,012 3,702 5,391 (9,093) 6,012
Noncontrolling Interest ——30—30
Total Shareholders’ Equity 6,012 3,702 5,421 (9,093) 6,042
Total Liabilities and Shareholders’ Equity $ 13,278 $ 5,494 $ 8,370 $ (15,246) $ 11,896