Tyson Foods 2012 Annual Report Download - page 16
Download and view the complete annual report
Please find page 16 of the 2012 Tyson Foods annual report below. You can navigate through the pages in the report by either clicking on the pages listed below, or by using the keyword search tool below to find specific information within the annual report.-
 1
1 -
2
-
3
-
4
-
5
-
 6
6 -
 7
7 -
 8
8 -
 9
9 -
 10
10 -
 11
11 -
 12
12 -
 13
13 -
 14
14 -
 15
15 -
 16
16 -
 17
17 -
 18
18 -
 19
19 -
 20
20 -
 21
21 -
 22
22 -
 23
23 -
 24
24 -
 25
25 -
 26
26 -
27
-
28
-
29
-
30
-
31
-
32
-
33
-
34
-
35
-
36
-
37
-
38
-
39
-
40
-
41
-
42
-
43
-
44
-
45
-
46
-
47
-
48
-
49
-
50
-
51
-
52
-
53
-
54
-
55
-
56
-
57
-
58
-
59
-
60
-
61
-
62
-
63
-
64
-
65
-
66
-
67
-
68
-
69
-
70
-
71
-
72
-
73
-
74
-
75
-
76
-
77
-
78
-
79
-
80
-
81
-
82
-
83
-
84
-
85
-
86
-
87
-
88
-
89
-
90
-
91
 |
 |
16
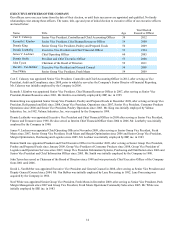
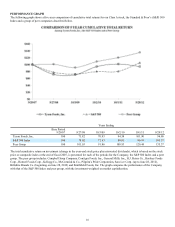
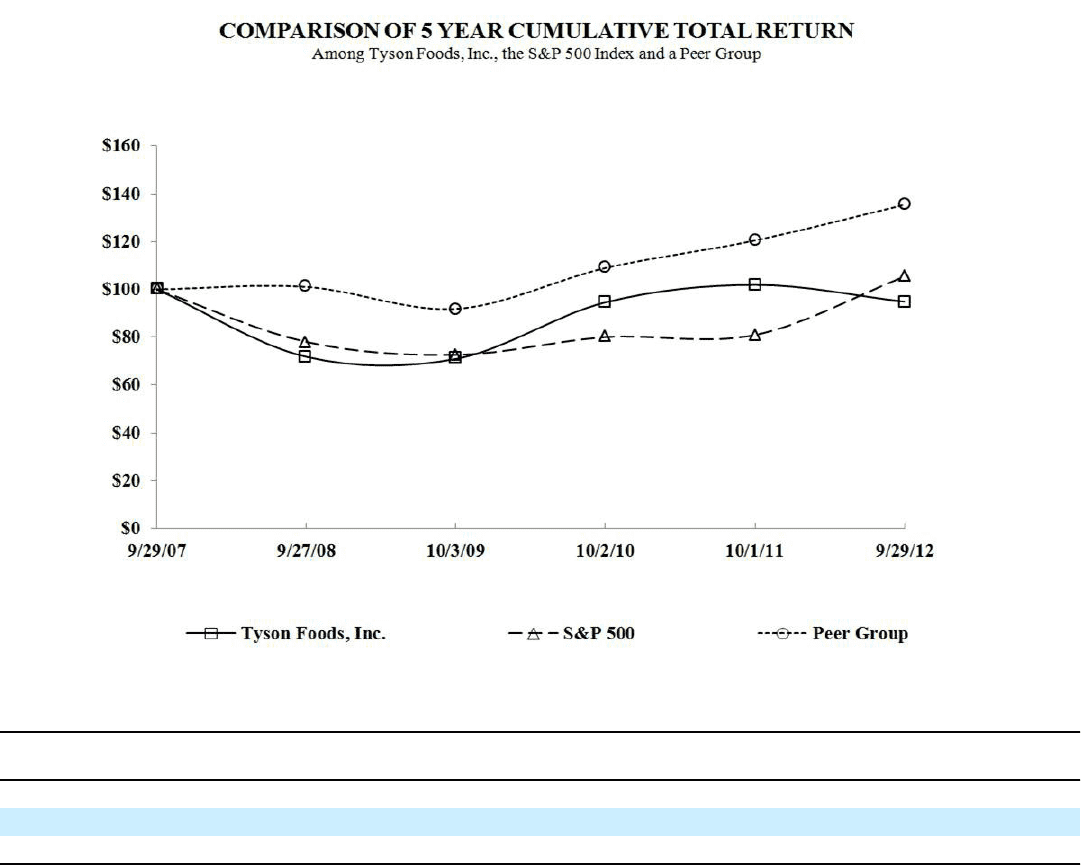
PERFORMANCE GRAPH
The following graph shows a five-year comparison of cumulative total returns for our Class A stock, the Standard & Poor’s (S&P) 500
Index and a group of peer companies described below.
Years Ending
Base Period
9/29/07 9/27/08 10/3/09 10/2/10 10/1/11 9/29/12
Tyson Foods, Inc. 100 71.82 70.93 94.58 101.90 94.86
S&P 500 Index 100 78.02 72.63 80.01 80.93 105.37
Peer Group 100 101.03 91.86 108.93 120.44 135.37
The total cumulative return on investment (change in the year-end stock price plus reinvested dividends), which is based on the stock
price or composite index at the end of fiscal 2007, is presented for each of the periods for the Company, the S&P 500 Index and a peer
group. The peer group includes: Campbell Soup Company, ConAgra Foods, Inc., General Mills, Inc., H.J. Heinz Co., Hershey Foods
Corp., Hormel Foods Corp., Kellogg Co., McCormick & Co., Pilgrim’s Pride Corporation, Sara Lee Corp. (up to June 28, 2012),
Hillshire Brands Co. (beginning on June 28, 2012) and Smithfield Foods, Inc. The graph compares the performance of the Company
with that of the S&P 500 Index and peer group, with the investment weighted on market capitalization.