Tyson Foods 2004 Annual Report Download - page 67
Download and view the complete annual report
Please find page 67 of the 2004 Tyson Foods annual report below. You can navigate through the pages in the report by either clicking on the pages listed below, or by using the keyword search tool below to find specific information within the annual report.-
 1
1 -
2
-
3
-
4
-
5
-
6
-
7
-
8
-
9
-
10
-
11
-
12
-
13
-
14
-
15
-
16
-
17
-
18
-
19
-
20
-
21
-
22
-
23
-
24
-
25
-
26
-
27
-
28
-
29
-
30
-
31
-
32
-
33
-
34
-
35
-
36
-
37
-
38
-
39
-
40
-
41
-
42
-
43
-
44
-
45
-
46
-
47
-
48
-
49
-
50
-
51
-
52
-
53
-
54
-
55
-
56
-
 57
57 -
 58
58 -
 59
59 -
 60
60 -
 61
61 -
 62
62 -
 63
63 -
 64
64 -
 65
65 -
 66
66 -
 67
67 -
 68
68 -
 69
69 -
 70
70 -
 71
71 -
 72
72
 |
 |

65
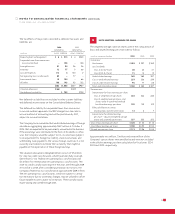
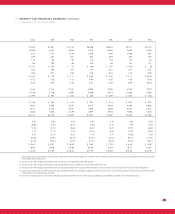
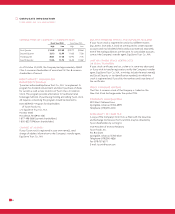
ELEVEN-YEAR FINANCIAL SUMMARY (CONTINUED)
2000 1999 1998 1997 1996 1995 1994
$7,268 $7,621 $7,414 $6,356 $6,454 $5,511 $5,110
6,453 6,470 6,260 5,318 5,506 4,423 4,149
815 1,151 1,154 1,038 948 1,088 961
349 487 204 400 269 472 195
116 124 139 110 133 115 86
83 129 46 144 49 131 121
$ 151 $ 230 $ 25 $ 186 $ 87 $ 219 $ (2)
225 229 231 213 217 217 218
226 231 228 218 218 218 222
$ 0.67 $ 1.00 $ 0.11 $ 0.85 $ 0.40 $ 1.01 $ (0.01)
0.70 1.05 0.12 0.90 0.42 1.06 (0.01)
0.63 0.94 0.10 0.81 0.38 0.95 (0.01)
0.160 0.115 0.100 0.095 0.080 0.053 0.047
0.144 0.104 0.090 0.086 0.072 0.044 0.039
$ 294 $ 291 $ 276 $ 230 $ 239 $ 205 $ 188
$ 196 $ 363 $ 310 $ 291 $ 214 $ 347 $ 232
4,841 5,083 5,242 4,411 4,544 4,444 3,668
2,141 2,185 2,257 1,925 1,869 2,014 1,610
1,542 1,804 2,129 1,690 1,975 1,985 1,455
$2,175 $2,128 $1,970 $1,621 $1,542 $1,468 $1,289
2.0% 3.0% 0.3% 2.9% 1.4% 4.0% 0.0%
(4.6)% 2.8% 16.7% (1.5)% 17.1% 7.9% 8.6%
11.2% 15.1% 15.6% 16.3% 14.7% 19.7% 18.8%
7.1% 11.7% 1.5% 12.1% 5.9% 17.0% (0.2)%
9.1% 12.1% 5.5% 11.7% 7.7% 15.2% 7.6%
35.6% 34.9% 64.7% 43.6% 37.0% 38.1% 101.8%
41.5% 45.9% 51.9% 51.0% 56.2% 57.5% 53.0%
$ 9.67 $ 9.31 $ 8.53 $ 7.60 $ 7.09 $ 6.76 $ 5.92
18.00 25.38 24.44 23.63 18.58 18.17 16.67
$ 8.56 $15.00 $16.50 $17.75 $13.83 $13.83 $12.50
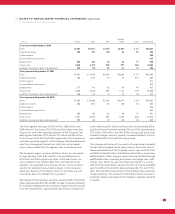
9. Significant business combinations accounted for as purchases: TFM, Hudson Foods, Inc. and Arctic Alaska Fisheries Corporation in August 2001 and September 2001, January 1998
and October 1992, respectively.
10. The results for 1998 include a $215 million pretax charge for asset impairment and other charges.
11. The results for 1997 include a $41 million pretax gain ($4 million after tax) from the sale of the beef division assets.
12. The results for 1994 include a $214 million pretax charge ($205 million after tax) due to the write-down of certain long-lived assets of Arctic Alaska Fisheries Corporation.
13. Earnings per share for all years presented have been restated to reflect the Company’s adoption of EITF Issue No. 03-6, “Participating Securities and the Two-Class Method under
FASB Statement No. 128, Earnings per Share.”
14. Return on invested capital is calculated by dividing operating income by the sum of the average of beginning and ending total debt and shareholders’ equity.