Tyson Foods 2004 Annual Report Download - page 55
Download and view the complete annual report
Please find page 55 of the 2004 Tyson Foods annual report below. You can navigate through the pages in the report by either clicking on the pages listed below, or by using the keyword search tool below to find specific information within the annual report.-
 1
1 -
2
-
3
-
4
-
5
-
6
-
7
-
8
-
9
-
10
-
11
-
12
-
13
-
14
-
15
-
16
-
17
-
18
-
19
-
20
-
21
-
22
-
23
-
24
-
25
-
26
-
27
-
28
-
29
-
30
-
31
-
32
-
33
-
34
-
35
-
36
-
37
-
38
-
39
-
40
-
41
-
42
-
43
-
44
-
 45
45 -
 46
46 -
 47
47 -
 48
48 -
 49
49 -
 50
50 -
 51
51 -
 52
52 -
 53
53 -
 54
54 -
 55
55 -
 56
56 -
 57
57 -
 58
58 -
 59
59 -
 60
60 -
 61
61 -
 62
62 -
 63
63 -
 64
64 -
 65
65 -
66
-
67
-
68
-
69
-
70
-
71
-
72
 |
 |

53
NOTES TO CONSOLIDATED FINANCIAL STATEMENTS (CONTINUED)
The Company has four postretirement health plans. Two of these
consist of fixed, annual payments by the Company and account for
$36 million of the Company’s postretirement medical obligation at
October 2, 2004. A healthcare cost trend is not required to determine
this obligation. A third plan has a negotiated annual maximum payment
by the Company and accounts for $12 million of the Company’s post-
retirement medical obligation at October 2, 2004. Claims in excess
of the Company’s negotiated annual maximum payment are paid by
the plan participants. Since current medical claims exceed the annual
maximum cap for this plan, the liability was calculated assuming that
annual claims will be equal to the total annual maximum cap for all
future years. A healthcare cost trend is not required to determine
this obligation. The fourth plan, which accounts for $18 million of
the Company’s postretirement medical obligation at year end, uses
a healthcare cost trend of 9% in the current year that grades down
to 5% in fiscal year 2009. Assumed healthcare cost trend rates have
a significant effect on the amounts reported for this healthcare plan.
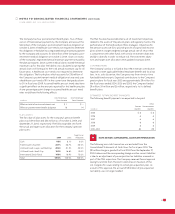
A one-percentage-point change in assumed healthcare cost trend
rates would have the following effects:
One-Percentage- One-Percentage-
in millions Point Increase Point Decrease
Effect on total of service and interest cost $1 $–
Effect on postretirement benefit obligation 18 14
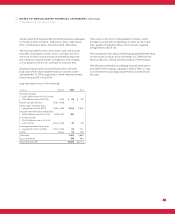
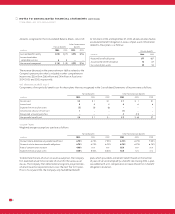
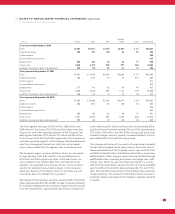
The fair value of plan assets for the Company’s pension benefit
plans was $59 million and $50 million as of October 2, 2004, and
September 27, 2003, respectively. The following table sets forth
the actual and target asset allocation for the Company’s pension
plan assets:
Target Asset
2004 2003 Allocation
Cash 0.8% 6.1% 0.0%
Fixed income securities 24.7% 26.7% 25.0%
US Stock Funds–Large- and Mid-Cap 49.6% 31.5% 50.0%
US Stock Funds–Small-Cap 10.0% 16.8% 10.0%
International Stock Funds 14.9% 18.9% 15.0%
Total 100.0% 100.0% 100.0%
The Plan Trustees have established a set of investment objectives
related to the assets of the pension plans and regularly monitor the
performance of the funds and portfolio managers. Objectives for
the pension assets are (1) to provide growth of capital and income,
(2) to achieve a target weighted average annual rate of return that
is competitive with other funds with similar investment objectives
and (3) to diversify in order to reduce risk. The investment objec-
tives and target asset allocation were updated in January 2004.
The Company’s policy is to fund at least the minimum contribution
required to meet applicable federal employee benefit and local tax
laws. In its sole discretion, the Company may from time to time
fund additional amounts. Expected contributions to the Company’s
pension plans for fiscal year 2005 are approximately $9 million. For
the fiscal years ended 2004, 2003 and 2002, the Company funded
$9 million, $4 million and $5 million, respectively, to its defined
benefit plans.
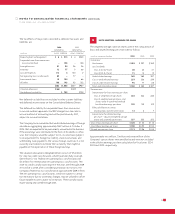
The following benefit payments are expected to be paid:
Other
Pension Postretirement
in millions Benefits Benefits
2005 $6 $6
2006 66
2007 66
2008 66
2009 66
2010–2014 30 29
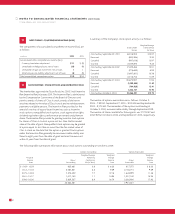
NOTE SIXTEEN : SUPPLEMENTAL CASH FLOW INFORMATION
The following non-cash transaction was excluded from the
Consolidated Statements of Cash Flows for fiscal year 2004. The
$91 million change in goodwill in fiscal 2004 from the September 27,
2003, balance and the corresponding change in other current liabilities
is due to an adjustment of pre-acquisition tax liabilities assumed as
part of the TFM acquisition. The Company received formal approval
during fiscal 2004 from The Joint Committee on Taxation of the
U.S. Congress for issues relating to certain pre-acquisition years. As
a result of this approval, the accrual of $91 million of pre-acquisition
tax liability was no longer needed.