Tyson Foods 2004 Annual Report Download - page 22
Download and view the complete annual report
Please find page 22 of the 2004 Tyson Foods annual report below. You can navigate through the pages in the report by either clicking on the pages listed below, or by using the keyword search tool below to find specific information within the annual report.-
 1
1 -
2
-
3
-
4
-
5
-
6
-
7
-
8
-
9
-
10
-
11
-
 12
12 -
 13
13 -
 14
14 -
 15
15 -
 16
16 -
 17
17 -
 18
18 -
 19
19 -
 20
20 -
 21
21 -
 22
22 -
 23
23 -
 24
24 -
 25
25 -
 26
26 -
 27
27 -
 28
28 -
 29
29 -
 30
30 -
 31
31 -
 32
32 -
33
-
34
-
35
-
36
-
37
-
38
-
39
-
40
-
41
-
42
-
43
-
44
-
45
-
46
-
47
-
48
-
49
-
50
-
51
-
52
-
53
-
54
-
55
-
56
-
57
-
58
-
59
-
60
-
61
-
62
-
63
-
64
-
65
-
66
-
67
-
68
-
69
-
70
-
71
-
72
 |
 |

20
MANAGEMENT’S DISCUSSION AND ANALYSIS (CONTINUED)
resulted from a reduction in the estimated 2004 profit from export
sales primarily due to the effects of BSE and avian influenza, along
with an adjustment to the estimated 2003 benefit. The 2004 estimated
rate also increased due to the expiration of certain general business
credits. On October 22, 2004, the President signed into law the
American Jobs Creation Act of 2004 which provides, among other
things, for the repeal of the ETI benefit phased in from 2004 through
2006. The Act also provided for a domestic production deduction
which will be available to the Company beginning in the 2006 fiscal
year. The Company is currently in the process of evaluating the Act.
Tyson operates in five business segments: Chicken, Beef, Pork,
Prepared Foods and Other. The Company measures segment
profit as operating income.
is involved primarily in the processing of live
chickens into fresh, frozen and value-added chicken products.
The Chicken segment markets its products domestically to food
retailers, foodservice distributors, restaurant operators and
noncommercial foodservice establishments such as schools, hotel
chains, healthcare facilities, the military and other food processors,
as well as to international markets throughout the world. The
Chicken segment also includes sales from allied products and
the chicken breeding stock subsidiary.
is involved primarily in the processing of live fed
cattle and fabrication of dressed beef carcasses into primal and
sub-primal meat cuts and case-ready products. It also involves
deriving value from allied products such as hides and variety meats
for sale to further processors and others. The Beef segment markets
its products domestically to food retailers, foodservice distributors,
restaurant operators and noncommercial foodservice establishments
such as schools, hotel chains, healthcare facilities, the military and
other food processors, as well as to international markets throughout
the world. Allied products are also marketed to manufacturers of
pharmaceuticals and technical products.
is involved primarily in the processing of live market
hogs and fabrication of pork carcasses into primal and sub-primal
meat cuts and case-ready products. This segment also represents the
Company’s live swine group and related allied product processing
activities. The Pork segment markets its products domestically to
food retailers, foodservice distributors, restaurant operators and
noncommercial foodservice establishments such as schools, hotel
chains, healthcare facilities, the military and other food processors,
as well as to international markets throughout the world. It also
sells allied products to pharmaceutical and technical products
manufacturers, as well as live swine to pork producers.
includes the Company’s operations that
manufacture and market frozen and refrigerated food products.
Products include pepperoni, beef and pork toppings, pizza crusts,
flour and corn tortilla products, appetizers, prepared meals, ethnic
foods, soups, sauces, side dishes and meat dishes, as well as branded
and processed meats. The Prepared Foods segment markets its
products domestically to food retailers, foodservice distributors,
restaurant operators and noncommercial foodservice establishments
such as schools, hotel chains, healthcare facilities, the military and
other food processors, as well as to international markets throughout
the world.
includes the logistics group and other corporate
activities not identified with specific protein groups.
Sales by Segment
Volume Avg. Price
in millions 2004 2003 Change Change Change
Chicken $ 8,397 $ 7,427 $ 970 3.5% 9.2%
Beef 11,951 11,935 16 (9.8)% 11.0%
Pork 3,185 2,470 715 7.3% 20.2%
Prepared Foods 2,857 2,662 195 0.2% 7.1%
Other 51 55 (4) N/A N/A
Total $26,441 $24,549 $1,892 (1.5)% 9.4%
Operating Income by Segment
Margin
Margin
in millions 2004 2003 Change 2004 2003
Chicken $548 $158 $ 390 6.5% 2.1%
Beef 127 320 (193) 1.1% 2.7%
Pork 140 75 65 4.4% 3.0%
Prepared Foods 28 57 (29) 1.0% 2.1%
Other 82 227 (145) N/A N/A
Total $925 $837 $ 88 3.5% 3.4%
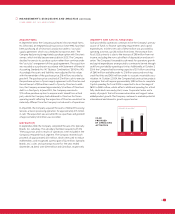
sales increased 13.1% in fiscal 2004 as compared
to the same period last year. Foodservice chicken sales increased
11.3%, retail chicken sales increased 16.2% and international chicken
sales increased 14.5%. Excluding plant closing related accruals of
$13 million and $76 million recorded in fiscal 2004 and 2003,
respectively, and fixed asset write-downs of $13 million recorded
in fiscal 2004, operating income increased $340 million. Sales and
operating income increases primarily are due to increased average
selling prices and sales volumes, as well as improvements in product
mix and operating efficiencies. Operating income was negatively
impacted by approximately $239 million of increased grain costs,
partially offset by a benefit of approximately $127 million from the
Company’s on-going commodity risk management activities related