Tyson Foods 2004 Annual Report Download - page 66
Download and view the complete annual report
Please find page 66 of the 2004 Tyson Foods annual report below. You can navigate through the pages in the report by either clicking on the pages listed below, or by using the keyword search tool below to find specific information within the annual report.-
 1
1 -
2
-
3
-
4
-
5
-
6
-
7
-
8
-
9
-
10
-
11
-
12
-
13
-
14
-
15
-
16
-
17
-
18
-
19
-
20
-
21
-
22
-
23
-
24
-
25
-
26
-
27
-
28
-
29
-
30
-
31
-
32
-
33
-
34
-
35
-
36
-
37
-
38
-
39
-
40
-
41
-
42
-
43
-
44
-
45
-
46
-
47
-
48
-
49
-
50
-
51
-
52
-
53
-
54
-
55
-
 56
56 -
 57
57 -
 58
58 -
 59
59 -
 60
60 -
 61
61 -
 62
62 -
 63
63 -
 64
64 -
 65
65 -
 66
66 -
 67
67 -
 68
68 -
 69
69 -
 70
70 -
 71
71 -
 72
72
 |
 |

64
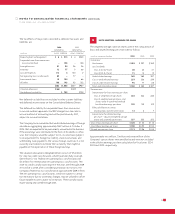
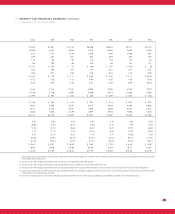
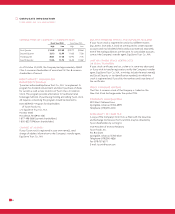
ELEVEN-YEAR FINANCIAL SUMMARY
in millions, except per share and ratio data 2004 2003 2002 2001
Summary of Operations
Sales $26,441 $24,549 $23,367 $10,563
Cost of sales 24,550 22,805 21,550 9,660
Gross profit 1,891 1,744 1,817 903
Operating income 925 837 887 316
Interest expense 275 296 305 144
Provision for income taxes 232 186 210 58
Net income (loss) $403 $ 337 $ 383 $ 88
Year end shares outstanding 353 353 353 349
Diluted average shares outstanding 357 352 355 222
Diluted earnings (loss) per share $1.13 $ 0.96 $ 1.08 $ 0.40
Class A basic earnings (loss) per share 1.20 1.00 1.13 0.42
Class B basic earnings (loss) per share 1.08 0.90 1.02 0.38
Dividends per share:
Class A 0.160 0.160 0.160 0.160
Class B 0.144 0.144 0.144 0.144
Depreciation and amortization $490 $ 458 $ 467 $ 335
Balance Sheet Data
Capital expenditures $486 $ 402 $ 433 $ 261
Total assets 10,464 10,486 10,372 10,632
Net property, plant and equipment 3,964 4,039 4,038 4,085
Total debt 3,362 3,604 3,987 4,776
Shareholders’ equity $ 4,292 $ 3,954 $ 3,662 $ 3,354
Other Key Financial Measures
Return on sales 1.5% 1.4% 1.6% 0.8%
Annual sales growth (decline) 7.7% 5.1% 121.2% 45.3%
Gross margin 7.2% 7.1% 7.8% 8.5%
Return on beginning shareholders’ equity 10.2% 9.2% 11.4% 4.0%
Return on invested capital 12.2% 11.0% 11.2% 5.3%
Effective tax rate 36.6% 35.5% 35.5% 35.4%
Total debt to capitalization 43.9% 47.7% 52.1% 58.7%
Book value per share $ 12.19 $ 11.21 $ 10.37 $ 9.61
Closing stock price high 21.06 14.42 15.56 14.19
Closing stock price low $ 12.59 $ 7.28 $ 8.75 $ 8.35
1. Fiscal years 2004, 1998 and 1994 were 53-week years, while the other years presented were 52-week years.
2. The results for 2004 include $61 million of pretax BSE-related charges, $40 million of pretax charges related to closing two poultry and three prepared foods operations,
$25 million of pretax charges related to the impairment of intangible assets and $21 million of pretax charges related to fixed asset write-downs.
3. The results for 2003 include $167 million of pretax gains related to vitamin antitrust litigation settlements received and $76 million of pretax charges related to closing
four poultry operations.
4. The results for 2002 include a $27 million pretax charge related to the identifiable intangible asset write-down of the Thomas E. Wilson brand, $26 million pretax charge for live
swine restructuring charge, $22 million pretax gain related to the sale of Specialty Brands, Inc. and $30 million pretax gain related to vitamin antitrust litigation settlements received.
5. The results for 2001 include $26 million of pretax charges for expenses related to the TFM acquisition, loss on sale of swine assets, and product recall losses.
6. The results for 2000 include a $24 million pretax charge for a bad debt write-off related to the January 2000 bankruptcy filing of AmeriServe Food Distribution, Inc. and
a $9 million pretax charge related to Tyson de Mexico losses.
7. Certain costs for years 1999 and prior have not been reclassified as the result of the application of EITF 00-14 and EITF 00-25.
8. The results for 1999 include a $77 million pretax charge for loss on sale of assets and impairment write-downs.