Tyson Foods 2004 Annual Report Download - page 53
Download and view the complete annual report
Please find page 53 of the 2004 Tyson Foods annual report below. You can navigate through the pages in the report by either clicking on the pages listed below, or by using the keyword search tool below to find specific information within the annual report.-
 1
1 -
2
-
3
-
4
-
5
-
6
-
7
-
8
-
9
-
10
-
11
-
12
-
13
-
14
-
15
-
16
-
17
-
18
-
19
-
20
-
21
-
22
-
23
-
24
-
25
-
26
-
27
-
28
-
29
-
30
-
31
-
32
-
33
-
34
-
35
-
36
-
37
-
38
-
39
-
40
-
41
-
42
-
 43
43 -
 44
44 -
 45
45 -
 46
46 -
 47
47 -
 48
48 -
 49
49 -
 50
50 -
 51
51 -
 52
52 -
 53
53 -
 54
54 -
 55
55 -
 56
56 -
 57
57 -
 58
58 -
 59
59 -
 60
60 -
 61
61 -
 62
62 -
 63
63 -
64
-
65
-
66
-
67
-
68
-
69
-
70
-
71
-
72
 |
 |

51
NOTES TO CONSOLIDATED FINANCIAL STATEMENTS (CONTINUED)
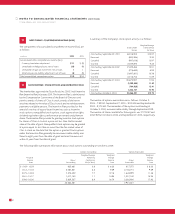
The weighted average fair value of options granted during 2004 was
approximately $5.99. The fair value of each option grant is established
on the date of grant using the Black-Scholes option-pricing model.
Assumptions include an expected life ranging from five to six years,
risk-free interest rate ranging from 3.09% to 3.27%, expected volatility
ranging from 37.7% to 40.1% and dividend yield of 1.00%.
At October 2, 2004, the Company had outstanding approximately
eight million restricted shares of Class A stock with restrictions
expiring over periods through July 1, 2020. The unearned portion
of the restricted stock is classified on the Consolidated Balance
Sheets as unamortized deferred compensation in shareholders’
equity. The Company issues restricted stock at the market value as
of the date of grant. The weighted average fair value of restricted
stock granted was $15.69 per share during 2004 and $11.20 per share
during 2003.
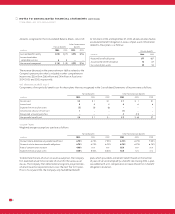
NOTE FOURTEEN : DEFERRED COMPENSATION
In July 2003, the Compensation Committee authorized the Company
to award performance-based shares of the Company’s Class A stock to
certain senior executive officers on the first business day of each
of the Company’s 2004, 2005 and 2006 fiscal years having an initial
maximum aggregate value of $4.4 million on the date of each award.
The vesting of the performance-based shares for the 2004 and 2005
awards is over three years, and the vesting of the 2006 award is over
two and one-half years (the Vesting Period), each award being subject
to the attainment of Company goals determined by the Compensation
Committee prior to the date of the award. Each quarter during the
Vesting Period, the Company reviews progress toward attainment
of Company goals and determines if it is appropriate to record any
adjustment to the deferred compensation liability for the antici-
pated vesting of the shares. The attainment of Company goals can
be finally determined only at the end of the Vesting Period. If the
shares vest, the ultimate expense to the Company recognized over
the Vesting Period will be equal to the Class A stock price on the
date the shares vest times the number of shares awarded.
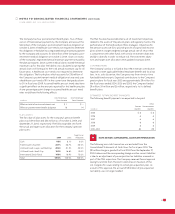
NOTE FIFTEEN : PENSIONS AND
OTHER POSTRETIREMENT BENEFITS
The Company has both funded and unfunded noncontributory
defined benefit pension plans covering specific groups of employees.
Two plans provide benefits based on a formula using years of service
and a specified benefit rate. Effective January 1, 2004, the Company
implemented a new defined benefit plan for certain contracted
officers that uses a formula based on years of service and final average
salary. The Company also has other postretirement benefit plans
for which substantially all of its employees may receive benefits
if they satisfy applicable eligibility criteria. The postretirement
healthcare plans are contributory with participants’ contributions
adjusted when deemed necessary.
The Company has defined contribution retirement and incentive
benefit programs for various groups of Company personnel.
Company contributions totaled $55 million, $48 million and
$50 million in 2004, 2003 and 2002, respectively.
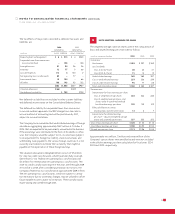
The Company uses a September 30 measurement date for its
defined benefit plans and one postretirement medical plan and
a July 31 measurement date for its remaining postretirement
medical plans.
Other postretirement benefits include postretirement medical
costs and life insurance.
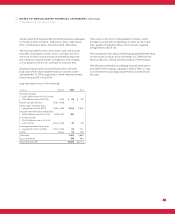
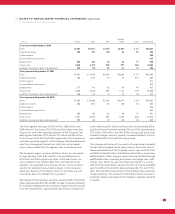
The following table provides a reconciliation of the changes in the
plans’ benefit obligations, assets and funded status as of fiscal year
ends October 2, 2004, and September 27, 2003:
Other Postretirement
Pension Benefits Benefits
in millions 2004 2003 2004 2003
Change in benefit obligation
Benefit obligation
at beginning of year $67 $70 $66 $91
Service cost 3111
Interest cost 5446
Plan participants’ contributions ––32
Amendments 9––(10)
Actuarial (gain)/loss (1) (2) 5(13)
Benefits paid (6) (6) (13) (11)
Benefit obligation at end of year 77 67 66 66
Change in plan assets
Fair value of plan assets
at beginning of year 50 43 ––
Actual return on plan assets 69––
Employer contributions 9410 9
Plan participants’ contributions ––32
Benefits paid (6) (6) (13) (11)
Fair value of plan assets
at end of year 59 50 ––
Funded status (18) (17) (66) (66)
Amounts not yet recognized:
Unrecognized prior service cost 8–(9) (10)
Unrecognized actuarial loss 68––
Net amount recognized $(4) $(9) $(75) $(76)