Tyson Foods 2004 Annual Report Download - page 47
Download and view the complete annual report
Please find page 47 of the 2004 Tyson Foods annual report below. You can navigate through the pages in the report by either clicking on the pages listed below, or by using the keyword search tool below to find specific information within the annual report.-
 1
1 -
2
-
3
-
4
-
5
-
6
-
7
-
8
-
9
-
10
-
11
-
12
-
13
-
14
-
15
-
16
-
17
-
18
-
19
-
20
-
21
-
22
-
23
-
24
-
25
-
26
-
27
-
28
-
29
-
30
-
31
-
32
-
33
-
34
-
35
-
36
-
 37
37 -
 38
38 -
 39
39 -
 40
40 -
 41
41 -
 42
42 -
 43
43 -
 44
44 -
 45
45 -
 46
46 -
 47
47 -
 48
48 -
 49
49 -
 50
50 -
 51
51 -
 52
52 -
 53
53 -
 54
54 -
 55
55 -
 56
56 -
 57
57 -
58
-
59
-
60
-
61
-
62
-
63
-
64
-
65
-
66
-
67
-
68
-
69
-
70
-
71
-
72
 |
 |

45
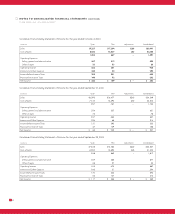
NOTES TO CONSOLIDATED FINANCIAL STATEMENTS (CONTINUED)
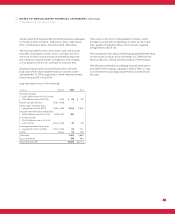
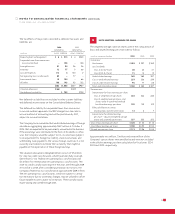
Condensed Consolidating Balance Sheet as of October 2, 2004
in millions Tyson TFM Adjustments Consolidated
Assets
Current Assets:
Cash and cash equivalents $ 19 $ 14 $ – $ 33
Accounts receivable, net 579 875 (214) 1,240
Inventories 1,258 805 2,063
Other current assets 149 47 196
Total Current Assets 2,005 1,741 (214) 3,532
Net Property, Plant and Equipment 2,237 1,727 3,964
Goodwill 957 1,601 2,558
Intangible Assets –149 149
Other Assets 3,074 93 (2,906) 261
Total Assets $8,273 $5,311 $(3,120) $10,464
Liabilities and Shareholders’ Equity
Current Liabilities:
Current debt $ 337 $ 1 $ – $ 338
Trade accounts payable 456 489 945
Other current liabilities 917 1,999 (1,906) 1,010
Total Current Liabilities 1,710 2,489 (1,906) 2,293
Long-Term Debt 2,525 499 3,024
Deferred Income Taxes 469 226 695
Other Liabilities 16 144 160
Shareholders’ Equity 3,553 1,953 (1,214) 4,292
Total Liabilities and Shareholders’ Equity $8,273 $5,311 $(3,120) $10,464