Tyson Foods 2004 Annual Report Download - page 49
Download and view the complete annual report
Please find page 49 of the 2004 Tyson Foods annual report below. You can navigate through the pages in the report by either clicking on the pages listed below, or by using the keyword search tool below to find specific information within the annual report.-
 1
1 -
2
-
3
-
4
-
5
-
6
-
7
-
8
-
9
-
10
-
11
-
12
-
13
-
14
-
15
-
16
-
17
-
18
-
19
-
20
-
21
-
22
-
23
-
24
-
25
-
26
-
27
-
28
-
29
-
30
-
31
-
32
-
33
-
34
-
35
-
36
-
37
-
38
-
 39
39 -
 40
40 -
 41
41 -
 42
42 -
 43
43 -
 44
44 -
 45
45 -
 46
46 -
 47
47 -
 48
48 -
 49
49 -
 50
50 -
 51
51 -
 52
52 -
 53
53 -
 54
54 -
 55
55 -
 56
56 -
 57
57 -
 58
58 -
 59
59 -
60
-
61
-
62
-
63
-
64
-
65
-
66
-
67
-
68
-
69
-
70
-
71
-
72
 |
 |
47
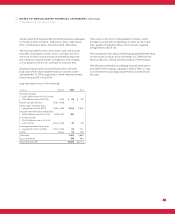
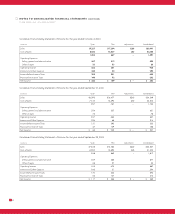
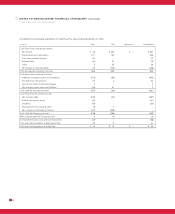
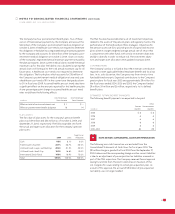
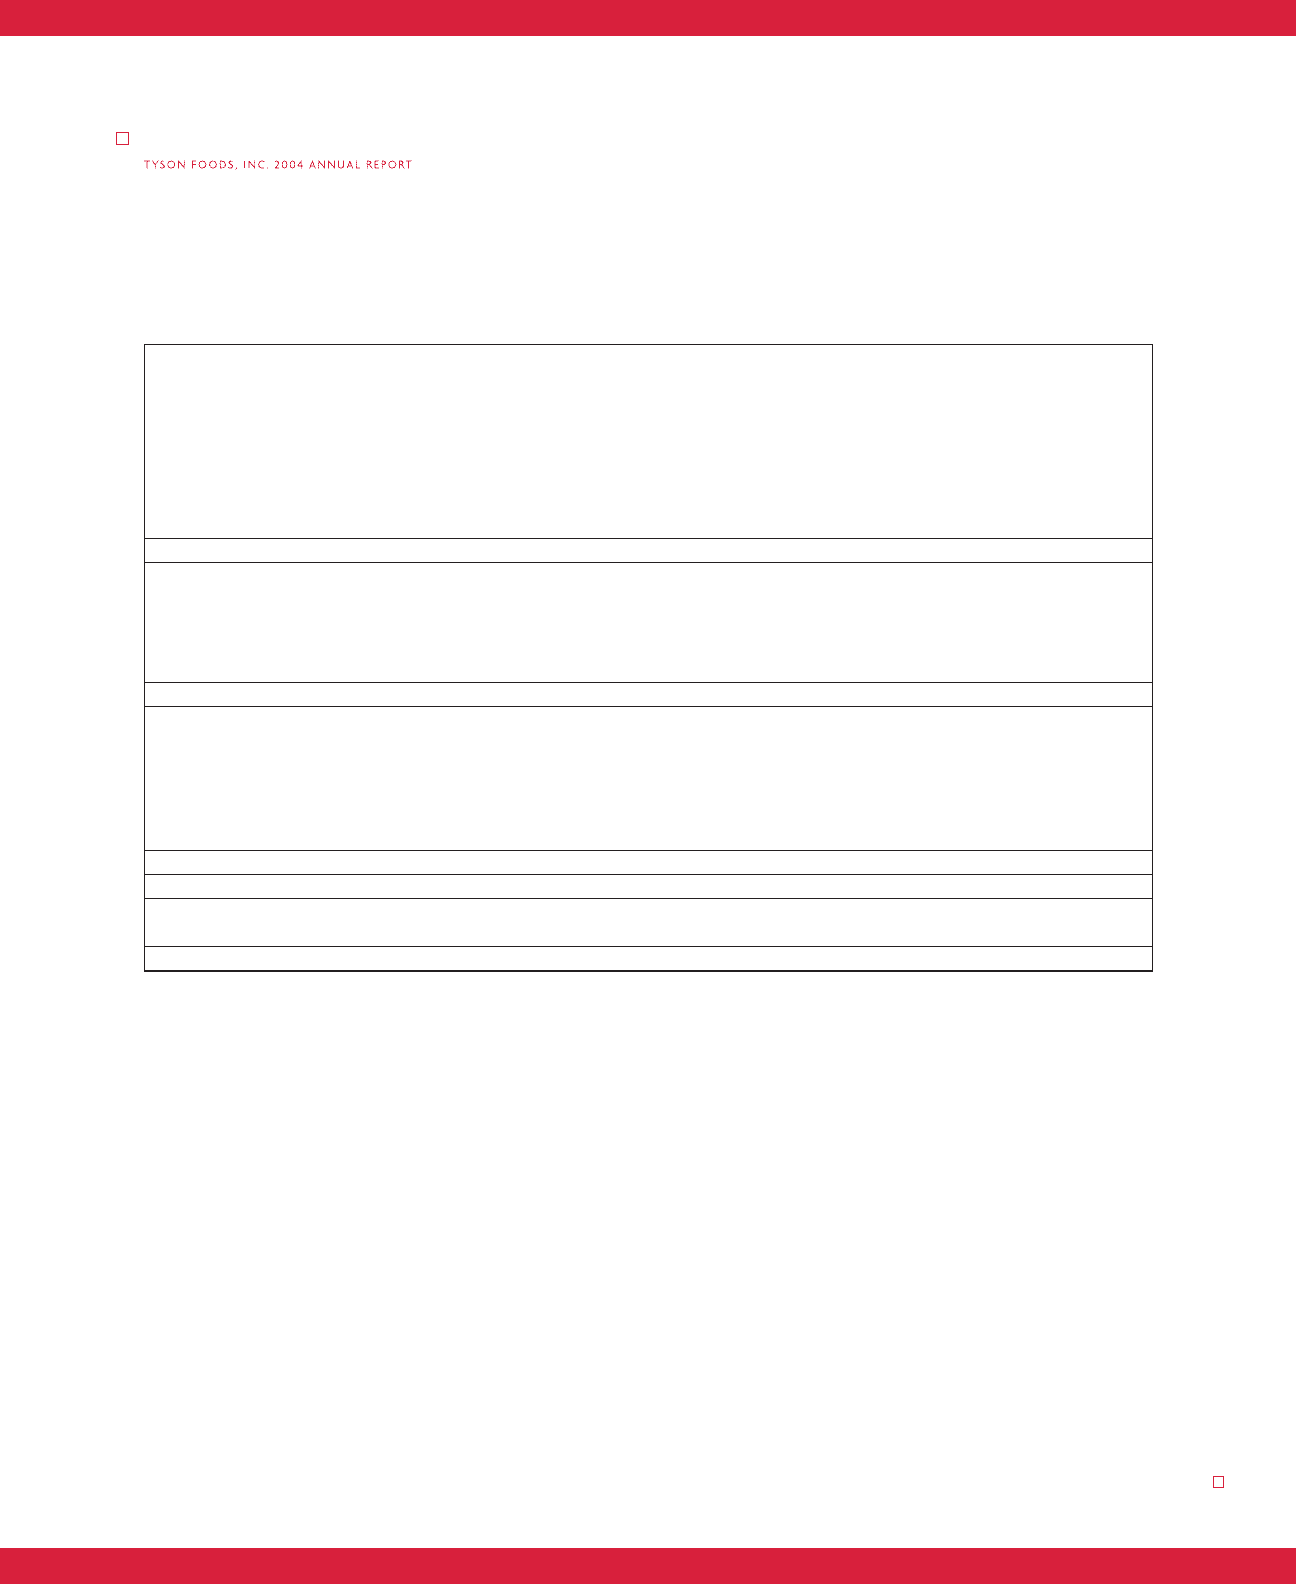
NOTES TO CONSOLIDATED FINANCIAL STATEMENTS (CONTINUED)
Condensed Consolidating Statement of Cash Flows for year ended October 2, 2004
in millions Tyson TFM Adjustments Consolidated
Cash Flows From Operating Activities:
Net income $244 $159 $ – $403
Depreciation and amortization 295 195 490
Plant closing related charges 35 (7) 28
Impairment and write-down of assets 14 32 46
Deferred taxes (24) 32 8
Other (4) 8 4
Net changes in working capital (160) 113 (47)
Cash Provided by Operating Activities 400 532 932
Cash Flows From Investing Activities:
Additions to property, plant and equipment (372) (114) (486)
Proceeds from sale of assets 22 5 27
Investment in marketable securities (99) – (99)
Net change in other assets and liabilities (28) (14) (42)
Cash Used for Investing Activities (477) (123) (600)
Cash Flows From Financing Activities:
Net change in debt (215) (27) (242)
Purchase of treasury shares (72) – (72)
Dividends (55) – (55)
Stock options exercised and other 42 1 43
Net change in intercompany balances 380 (380) –
Cash Used for Financing Activities 80 (406) (326)
Effect of Exchange Rate Change on Cash 11 2
Increase in Cash and Cash Equivalents 44 8
Cash and Cash Equivalents at Beginning of Year 15 10 25
Cash and Cash Equivalents at End of Year $19 $14 $ – $33