Tyson Foods 2004 Annual Report Download - page 5
Download and view the complete annual report
Please find page 5 of the 2004 Tyson Foods annual report below. You can navigate through the pages in the report by either clicking on the pages listed below, or by using the keyword search tool below to find specific information within the annual report.
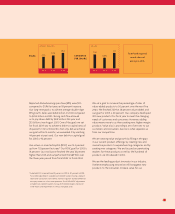
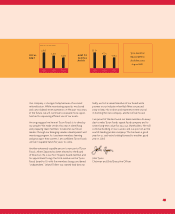
23.4 24.5
26.4
SALES
DOLLARS IN BILLIONS
1.08
0.96
1.13
EARNINGS
PER SHARE
DOLLARS
3
2002 2003 2004 2002 2003 2004
Tyson Foods reported
record sales and
earnings in 2004.
Reported diluted earnings per share (EPS) were $1.13
compared to $0.96 last year, an 18 percent increase.
Our long-term goal is to achieve average double-digit
EPS growth. Sales were $26.4 billion in 2004 compared
to $24.5 billion in 2003. Strong cash flow allowed
us to pay down debt by $242 million this year and
$1.5 billion since August 2001. One of the goals we set
for fiscal 2004 was to achieve a debt-to-capital ratio of
45 percent in 12 to 18 months. Not only did we achieve
our goal within 12 months, we exceeded it by reaching
44 percent at year’s end. Our new debt-to-capital goal
for 2005 is 40 percent.
Our return on invested capital (ROIC) was 12.2 percent,
up from 11.0 percent last year.* Our ROIC goal for 2005 is
14 percent. Our stock price finished the year 18 percent
higher than 2003 and outperformed the S&P 500 over
the three-year period from fiscal 2002 to fiscal 2004.
* Adjusted ROIC increased from 9.9 percent in 2003 to 14.1 percent in 2004.
Fiscal 2003 adjustments included costs related to plant closings, amounts
received in connection with vitamin antitrust litigation and impairment of
an equity interest in a live swine operation. Fiscal 2004 ROIC adjustments
included costs related to plant closings, BSE-related charges, fixed asset
write-downs and impairment of various intangible assets.
We set a goal to increase the percentage of sales of
value-added products to 50 percent over the next five
years. We finished 2004 at 38 percent value-added, and
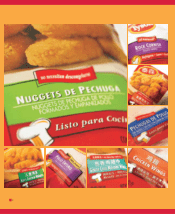
our goal for 2005 is 40 percent. Our company developed
400 new products this fiscal year to meet the changing
needs of customers and consumers. However, adding
value means more to us than creating new, higher margin
products. Value also is providing a set of services to our
customers and consumers. Service is what separates us
from our competition.
We are creating value and growth by filling in the gaps
in our current product offerings, by creating new and
innovative products to expand existing categories and by
creating new categories. We are focused on penetrating
markets for these products as well as the hundreds of
products we introduced in 2003.
We are the leading product innovator in our industry.
I believe emphasizing innovation will bring great new
products to the consumer, increase value for our

