Tyson Foods 2004 Annual Report Download - page 57
Download and view the complete annual report
Please find page 57 of the 2004 Tyson Foods annual report below. You can navigate through the pages in the report by either clicking on the pages listed below, or by using the keyword search tool below to find specific information within the annual report.-
 1
1 -
2
-
3
-
4
-
5
-
6
-
7
-
8
-
9
-
10
-
11
-
12
-
13
-
14
-
15
-
16
-
17
-
18
-
19
-
20
-
21
-
22
-
23
-
24
-
25
-
26
-
27
-
28
-
29
-
30
-
31
-
32
-
33
-
34
-
35
-
36
-
37
-
38
-
39
-
40
-
41
-
42
-
43
-
44
-
45
-
46
-
 47
47 -
 48
48 -
 49
49 -
 50
50 -
 51
51 -
 52
52 -
 53
53 -
 54
54 -
 55
55 -
 56
56 -
 57
57 -
 58
58 -
 59
59 -
 60
60 -
 61
61 -
 62
62 -
 63
63 -
 64
64 -
 65
65 -
 66
66 -
 67
67 -
68
-
69
-
70
-
71
-
72
 |
 |

55
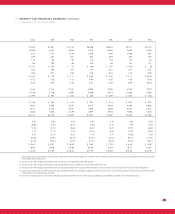
NOTES TO CONSOLIDATED FINANCIAL STATEMENTS (CONTINUED)
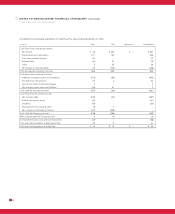
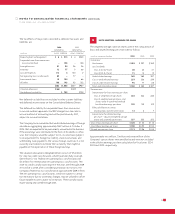
The tax effects of major items recorded as deferred tax assets and
liabilities are:
2004 2003
Deferred Tax Deferred Tax
in millions Assets Liabilities Assets Liabilities
Property, plant and equipment $4$513 $ 4 $543
Suspended taxes from conversion
to accrual method –138 – 138
Intangible assets 31 24 28 28
Inventory 12 77 586
Accrued expenses 114 4 120 2
Net operating loss carryforwards 83 – 77 –
International items 18 104 –68
All other 103 148 93 122
$365 $1,008 $327 $987
Valuation allowance $(66) $ (49)
Net deferred tax liability $709 $709
Net deferred tax liabilities are included in other current liabilities
and deferred income taxes on the Consolidated Balance Sheets.
The deferred tax liability for suspended taxes from conversion
to accrual method represents the 1987 change from the cash to
accrual method of accounting and will be paid down by 2017,
subject to income limitations.
The Company has accumulated but undistributed earnings of foreign
subsidiaries aggregating approximately $387 million at October 2,
2004, that are expected to be permanently reinvested in the business.
If those earnings were distributed in the form of dividends or other-
wise, the Company would be subject to U.S. income taxes (subject
to an adjustment for foreign tax credits), state income taxes and
withholding taxes payable to the various foreign countries. It is not
currently practicable to estimate the tax liability that might be
payable on the repatriation of these foreign earnings.
The valuation allowance totaling $66 million consists of $15 million
for state tax credit carryforwards, which have been fully reserved,
$36 million for U.S. federal net operating loss carryforwards and
$15 million for international net operating loss carryforwards. The
state tax credit carryforwards expire in the years 2005 through 2009.
At October 2, 2004, after considering utilization restrictions, the
Company’s federal tax loss carryforwards approximated $209 million.
The net operating loss carryforwards, which are subject to utiliza-
tion limitations due to ownership changes, may be utilized to offset
future taxable income subject to limitations. These carryforwards
expire during years 2005 through 2023.
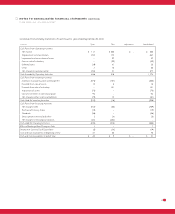
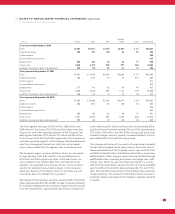
NOTE NINETEEN : EARNINGS PER SHARE
The weighted average common shares used in the computation of
basic and diluted earnings per share were as follows:
in millions, except per share data 2004 2003 2002
Numerator:
Net Income $403 $ 337 $ 383
Less Dividends:
Class A ($0.16/share) 40 40 41
Class B ($0.14/share) 15 14 15
Undistributed earnings 348 283 327
Class A undistributed earnings 253 206 239
Class B undistributed earnings 95 77 88
Total undistributed earnings $348 $ 283 $ 327
Denominator:
Denominator for basic earnings per share:
Class A weighted average shares 243 244 246
Class B weighted average shares, and
shares under if-converted method
for diluted earnings per share 102 102 102
Effect of dilutive securities:
Stock options and restricted stock 12 67
Denominator for diluted earnings
per share – adjusted weighted average
shares and assumed conversions 357 352 355
Class A Basic earnings per share $1.20 $1.00 $1.13
Class B Basic earnings per share $1.08 $0.90 $1.02
Diluted earnings per share $1.13 $0.96 $1.08
Approximately two million, 11 million and seven million of the
Company’s option shares were antidilutive and were not included
in the dilutive earnings per share calculation for fiscal years 2004,
2003 and 2002, respectively.