Tyson Foods 2004 Annual Report Download - page 30
Download and view the complete annual report
Please find page 30 of the 2004 Tyson Foods annual report below. You can navigate through the pages in the report by either clicking on the pages listed below, or by using the keyword search tool below to find specific information within the annual report.-
 1
1 -
2
-
3
-
4
-
5
-
6
-
7
-
8
-
9
-
10
-
11
-
12
-
13
-
14
-
15
-
16
-
17
-
18
-
19
-
 20
20 -
 21
21 -
 22
22 -
 23
23 -
 24
24 -
 25
25 -
 26
26 -
 27
27 -
 28
28 -
 29
29 -
 30
30 -
 31
31 -
 32
32 -
 33
33 -
 34
34 -
 35
35 -
 36
36 -
 37
37 -
 38
38 -
 39
39 -
 40
40 -
41
-
42
-
43
-
44
-
45
-
46
-
47
-
48
-
49
-
50
-
51
-
52
-
53
-
54
-
55
-
56
-
57
-
58
-
59
-
60
-
61
-
62
-
63
-
64
-
65
-
66
-
67
-
68
-
69
-
70
-
71
-
72
 |
 |

28
MANAGEMENT’S DISCUSSION AND ANALYSIS (CONTINUED)
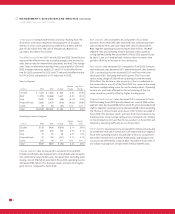
Effect of 10% Change in Fair Value
in millions 2004 2003
Livestock:
Cattle $12 $28
Hogs 18 12
Grain 526
Natural Gas 13 11
The Company has exposure to changes in interest
rates on its fixed-rate, long-term debt. Market risk for fixed-rate,
long-term debt is estimated as the potential increase in fair value,
resulting from a hypothetical 10% decrease in interest rates, and
amounts to approximately $51 million at October 2, 2004, and
$62 million at September 27, 2003. The fair values of the Company’s
long-term debt were estimated based upon quoted market prices
and/or published interest rates.
The Company hedges exposure to changes in interest rates on certain
of its financial instruments. Under the terms of various leveraged
equipment loans, the Company enters into interest rate swap
agreements to effectively lock in a fixed interest rate for these
borrowings. The maturity dates of these leveraged equipment loans
range from 2005 to 2008 with interest rates ranging from 4.7% to
6.0%. Because of the positions taken with respect to these swap
agreements, an increase in interest rates would have a minimal
effect on the fair value for fiscal years 2004 and 2003.
The Company has non-cash foreign exchange
gain/loss exposure from fluctuations in foreign currency exchange
rates as a result of certain receivables and payable balances. The
primary currency exchanges the Company has exposure to are the
Canadian dollar, the Mexican peso, the European euro, the British
pound sterling and the Brazilian real. The Company periodically enters
into foreign exchange forward contracts to hedge some of its foreign
currency exposure. There were no such contracts outstanding at
October 2, 2004, and September 27, 2003.
The Company’s financial instruments
that are exposed to concentrations of credit risk consist primarily
of cash equivalents and trade receivables. The Company’s cash
equivalents are in high quality securities placed with major banks and
financial institutions. Concentrations of credit risk with respect to
receivables are limited due to the large number of customers and
their dispersion across geographic areas. The Company performs
periodic credit evaluations of its customers’ financial condition
and generally does not require collateral. At October 2, 2004, and
September 27, 2003, approximately 15.0% and 10.3%, respectively,
of the Company’s net accounts receivable balance was due from one
customer. No other single customer or customer group represents
greater than 10% of net accounts receivable.
This report and other public communications issued by the Company
from time to time include certain non-GAAP financial measures,
which are defined as numerical measures of a company’s financial
performance, financial position or cash flows that exclude (or include)
amounts that are included in (or excluded from) the most directly
comparable measures calculated and presented in accordance with
GAAP in the Company’s financial statements.
Non-GAAP financial measures utilized by the Company include
presentations of operating income and other GAAP measures of
operating performance that exclude or include the effect of the
closings of selected operations, BSE-related charges, fixed asset
write-downs, impairment charges related to various intangible
assets, litigation settlements and other similar events. The Company’s
management believes these non-GAAP financial measures provide
useful information to investors by removing the effect of variances
in GAAP reported results of operations that are not indicative
of fundamental changes in the Company’s earnings. Management
also believes that the presentation of these non-GAAP financial
measures is consistent with its past practice, as well as industry
practice in general, and will enable investors and analysts to compare
current non-GAAP measures with non-GAAP measures presented
in prior periods. The non-GAAP financial measures used by the
Company should not be considered in isolation or as a substitute
for measures of performance prepared in accordance with GAAP.