Tyson Foods 2004 Annual Report Download - page 59
Download and view the complete annual report
Please find page 59 of the 2004 Tyson Foods annual report below. You can navigate through the pages in the report by either clicking on the pages listed below, or by using the keyword search tool below to find specific information within the annual report.-
 1
1 -
2
-
3
-
4
-
5
-
6
-
7
-
8
-
9
-
10
-
11
-
12
-
13
-
14
-
15
-
16
-
17
-
18
-
19
-
20
-
21
-
22
-
23
-
24
-
25
-
26
-
27
-
28
-
29
-
30
-
31
-
32
-
33
-
34
-
35
-
36
-
37
-
38
-
39
-
40
-
41
-
42
-
43
-
44
-
45
-
46
-
47
-
48
-
 49
49 -
 50
50 -
 51
51 -
 52
52 -
 53
53 -
 54
54 -
 55
55 -
 56
56 -
 57
57 -
 58
58 -
 59
59 -
 60
60 -
 61
61 -
 62
62 -
 63
63 -
 64
64 -
 65
65 -
 66
66 -
 67
67 -
 68
68 -
 69
69 -
70
-
71
-
72
 |
 |

57
NOTES TO CONSOLIDATED FINANCIAL STATEMENTS (CONTINUED)
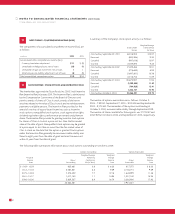
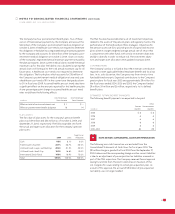
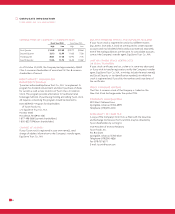
The Pork segment had sales of $473 million, $365 million and
$369 million for fiscal years 2004, 2003 and 2002, respectively, from
transactions with other operating segments of the Company. The
Beef segment had sales of $75 million, $77 million and $63 million
for fiscal years 2004, 2003 and 2002, respectively, from transactions
with other operating segments of the Company. The aforementioned
sales from intersegment transactions, which are sold at market
prices, were excluded from the segment sales in the above table.
The Company’s largest customer, Wal-Mart Stores, Inc., accounted
for approximately 11.6%, 9.6% and 8.2% of consolidated sales in
2004, 2003 and 2002, respectively. Sales to Wal-Mart Stores, Inc.
were included in the Chicken, Beef, Pork and Prepared Foods
segments. Any extended discontinuance of sales to this customer
could, if not replaced, have a material impact on the Company’s
operations; however, the Company does not anticipate any such
occurrences due to the demand for its products.
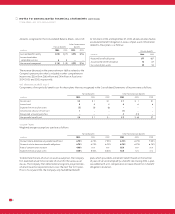
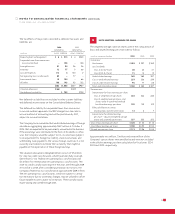
The majority of the Company’s operations are domiciled in the United
States. Approximately 94%, 95% and 94% of sales to external customers
for fiscal years ending 2004, 2003 and 2002, respectively, were sourced
from the United States. Approximately $6.4 billion of long-lived
assets were located in the United States at fiscal year ending 2004,
and $6.5 billion at fiscal years ending 2003 and 2002. Approximately
$171 million, $185 million and $193 million of long-lived assets were
located in foreign countries, primarily Canada and Mexico, at fiscal
years ended 2004, 2003 and 2002, respectively.
The Company sells certain of its products in foreign markets, primarily
Canada, China, European Union, Japan, Mexico, Puerto Rico, Russia,
Taiwan and South Korea. The Company’s export sales for 2004, 2003
and 2002 totaled $2.1 billion, $2.6 billion and $2.0 billion, respectively.
Substantially all of the Company’s export sales are facilitated through
unaffiliated brokers, marketing associations and foreign sales staffs.
Foreign sales, which are sales of products produced in a country
other than the United States, were less than 10% of total consolidated
sales for 2004, 2003 and 2002. Approximately 28%, 15% and 11% for
2004, 2003 and 2002, respectively, of income before taxes were from
foreign operations. The increase in fiscal 2004 primarily was due to
increased volumes and margins at the Company’s Lakeside operation
in Canada.
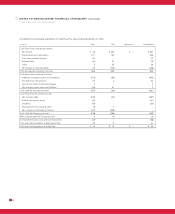
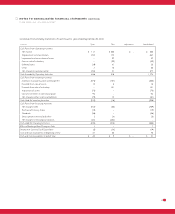
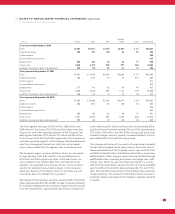
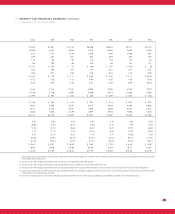
Prepared
in millions Chicken Beef Pork Foods Other Consolidated
Fiscal year ended October 2, 2004
Sales $8,397 $11,951 $3,185 $2,857 $ 51 $26,441
Operating income 548 127 140 28 82 925
Other expense 290
Income before income taxes 635
Depreciation 239 106 30 66 17 458
Total assets 4,556 3,195 895 10,464
Additions to property, plant and equipment 29890226115486
Fiscal year ended September 27, 2003
Sales $7,427 $11,935 $2,470 $2,662 $ 55 $24,549
Operating income 158 320 75 57 227 837
Other expense 314
Income before income taxes 523
Depreciation 217 90 26 54 40 427
Total assets 4,322 3,385 879 1,141 759 10,486
Additions to property, plant and equipment 286 40 9 15 52 402
Fiscal year ended September 28, 2002
Sales $7,222 $10,488 $2,503 $3,072 $ 82 $23,367
Operating income 428 220 25 158 56 887
Other expense 294
Income before income taxes 593
Depreciation 226 80 26 48 51 431
Total assets 4,221 3,234 834 1,261 822 10,372
Additions to property, plant and equipment 229 82 19 53 50 433
970 848