Tyson Foods 2004 Annual Report Download - page 24
Download and view the complete annual report
Please find page 24 of the 2004 Tyson Foods annual report below. You can navigate through the pages in the report by either clicking on the pages listed below, or by using the keyword search tool below to find specific information within the annual report.-
 1
1 -
2
-
3
-
4
-
5
-
6
-
7
-
8
-
9
-
10
-
11
-
12
-
13
-
 14
14 -
 15
15 -
 16
16 -
 17
17 -
 18
18 -
 19
19 -
 20
20 -
 21
21 -
 22
22 -
 23
23 -
 24
24 -
 25
25 -
 26
26 -
 27
27 -
 28
28 -
 29
29 -
 30
30 -
 31
31 -
 32
32 -
 33
33 -
 34
34 -
35
-
36
-
37
-
38
-
39
-
40
-
41
-
42
-
43
-
44
-
45
-
46
-
47
-
48
-
49
-
50
-
51
-
52
-
53
-
54
-
55
-
56
-
57
-
58
-
59
-
60
-
61
-
62
-
63
-
64
-
65
-
66
-
67
-
68
-
69
-
70
-
71
-
72
 |
 |

22
MANAGEMENT’S DISCUSSION AND ANALYSIS (CONTINUED)
increased $29 million, primarily resulting from the
$10 million write-down related to the impairment of an equity
interest in a live swine operation recorded in fiscal 2003, and the
gain of $22 million from the sale of the Specialty Brands, Inc.
subsidiary recorded in fiscal 2002.
was 35.5% in both 2003 and 2002. Several factors
impacted the effective tax rate including average state income tax
rates, the tax rates for international operations and the ETI for foreign
sales. Taxes on international earnings were comparable for 2003 and
2002. Average state taxes added 2.2% and 3.0% to the effective tax
rate for 2003 compared to 2002, and ETI reduced the effective rate
by 1.9% in 2003 compared to a 1.4% reduction in 2002.
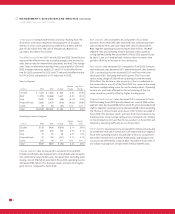
Sales by Segment
Volume Avg. Price
in millions 2003 2002 Change Change Change
Chicken $ 7,427 $ 7,222 $ 205 3.3% (0.4)%
Beef 11,935 10,488 1,447 0.5% 13.2%
Pork 2,470 2,503 (33) (4.1)% 2.9%
Prepared Foods 2,662 3,072 (410) (8.0)% (5.9)%
Other 55 82 (27) N/A N/A
Total $24,549 $23,367 $1,182 0.1% 5.0%
Operating Income by Segment
Margin Margin
in millions 2003 2002 Change 2003 2002
Chicken $158 $428 $(270) 2.1% 5.9%
Beef 320 220 100 2.7% 2.1%
Pork 75 25 50 3.0% 1.0%
Prepared Foods 57 158 (101) 2.1% 5.1%
Other 227 56 171 N/A N/A
Total $837 $887 $ (50) 3.4% 3.8%
sales increased 2.8% compared to fiscal 2002.
Foodservice chicken sales increased 4.2%, retail chicken sales increased
2.3% and international chicken sales decreased 3.6%. Excluding plant
closing costs of $76 million recorded in fiscal 2003, operating income
decreased $194 million. This decrease results primarily from higher
grain costs as compared to fiscal 2002.
sales increased 13.8% compared to fiscal 2002.
Domestic fresh meat beef sales increased 11.8%, international beef
sales increased 19.4% and case-ready beef sales increased 20.4%.
Beef segment operating income increased $100 million. The Beef
segment sales and operating income increases were caused by
strong demand during the second half of fiscal 2003 caused in part
by the U.S. ban on Canadian beef. However, these increases were
partially offset by an increase in live cattle prices.
sales decreased 1.3% compared to fiscal 2002. Domestic
fresh meat pork sales decreased 3.5%, international pork sales increased
2.8%, case-ready pork sales increased 52.3% and live swine sales
decreased 42.6%. Excluding the fourth quarter 2002 live swine
restructuring charge of $26 million, operating income increased
$24 million. The decline in sales primarily is due to a reduction in
live swine sales as a result of the fiscal 2002 live swine restructuring
and lower average selling prices for our finished product. Operating
income was positively affected by the restructuring of the live
swine operation, partially offset by higher live hog prices.
sales decreased 13.4% compared to fiscal
2002. Excluding fiscal 2002 Specialty Brands, Inc. sales of $244 million,
segment sales decreased $166 million and 5.9% and volume declined
slightly. Segment operating income decreased $128 million excluding
the Thomas E. Wilson brand write-down of $27 million recorded in
fiscal 2002. This decrease results primarily from the increases in raw
material prices, lower average selling prices, increased costs related
to the introduction of more than 75 new products in fiscal 2003 and
temporary operating inefficiencies at certain plants.
operating income increased $171 million primarily due
to settlements received in connection with vitamin antitrust litigation.
Fiscal 2003 operating income includes $167 million as compared to
$30 million received in fiscal 2002. Additionally, operating income
was positively affected by actuarial gains recorded in fiscal 2003 of
$13 million resulting from certain retiree medical benefit plans.