Tyson Foods 2004 Annual Report Download - page 43
Download and view the complete annual report
Please find page 43 of the 2004 Tyson Foods annual report below. You can navigate through the pages in the report by either clicking on the pages listed below, or by using the keyword search tool below to find specific information within the annual report.-
 1
1 -
2
-
3
-
4
-
5
-
6
-
7
-
8
-
9
-
10
-
11
-
12
-
13
-
14
-
15
-
16
-
17
-
18
-
19
-
20
-
21
-
22
-
23
-
24
-
25
-
26
-
27
-
28
-
29
-
30
-
31
-
32
-
 33
33 -
 34
34 -
 35
35 -
 36
36 -
 37
37 -
 38
38 -
 39
39 -
 40
40 -
 41
41 -
 42
42 -
 43
43 -
 44
44 -
 45
45 -
 46
46 -
 47
47 -
 48
48 -
 49
49 -
 50
50 -
 51
51 -
 52
52 -
 53
53 -
54
-
55
-
56
-
57
-
58
-
59
-
60
-
61
-
62
-
63
-
64
-
65
-
66
-
67
-
68
-
69
-
70
-
71
-
72
 |
 |

41
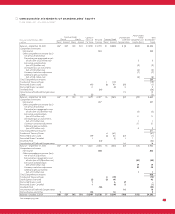
NOTES TO CONSOLIDATED FINANCIAL STATEMENTS (CONTINUED)
Additionally, the Company enters into certain forward sales of boxed
beef and pork at fixed prices and has positions in livestock futures
to mitigate the market risk associated with these fixed price forward
sales. The fixed price sales contract locks in the proceeds from a sale
in the future, although, the cost of the livestock and the related
boxed beef and pork market prices at the time of the sale will vary
from this fixed price, creating market risk. Therefore, as fixed forward
sales are entered into, the Company also enters into the appropriate
number of livestock futures positions. The Company believes this
is an effective economic hedge; however, the correlation does not
qualify for SFAS No. 133 hedge accounting. Consequently, changes
in market value of the open livestock futures positions are marked
to market and reported in earnings at each reporting date even
though the economic impact of the Company’s fixed sales price
being above or below the market price is only realized at the time of
sale. In connection with these livestock futures, the Company had
unrealized pretax gains on open mark-to-market futures positions
of approximately $15 million as of October 2, 2004, and $16 million
as of September 27, 2003.
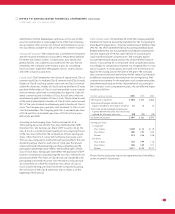
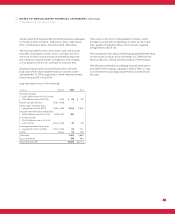
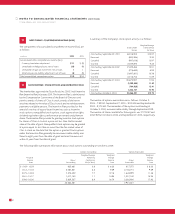
Fair Values of Financial Instruments:
Asset (Liability)
in millions 2004 2003
Commodity derivative positions $5$ (13)
Interest-rate derivative positions (1) (4)
Total debt $(3,700) $(4,011)
Fair values are based on quoted market prices or published
forward interest rate and natural gas curves. Carrying values for
derivative positions equal the fair values as of October 2, 2004,
and September 27, 2003, and the carrying values of total debt was
$3.4 billion and $3.6 billion, respectively. All other financial instruments’
fair values approximate recorded values at October 2, 2004, and
September 27, 2003.
The Company’s financial instruments
that are exposed to concentrations of credit risk consist primarily
of cash equivalents and trade receivables. The Company’s cash
equivalents are in high quality securities placed with major banks
and financial institutions. Concentrations of credit risk with respect
to receivables are limited due to the large number of customers and
their dispersion across geographic areas. The Company performs
periodic credit evaluations of its customers’ financial condition
and generally does not require collateral. At October 2, 2004, and
September 27, 2003, approximately 15.0% and 10.3%, respectively,
of the Company’s net accounts receivable balance was due from
one customer. No other single customer or customer group represents
greater than 10% of net accounts receivable.
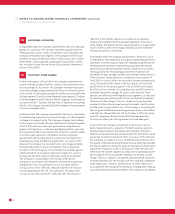
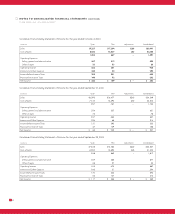
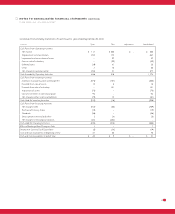
NOTE EIGHT : PROPERTY, PLANT AND EQUIPMENT
The major categories of property, plant and equipment and
accumulated depreciation at cost, at October 2, 2004, and
September 27, 2003, are as follows:
in millions 2004 2003
Land $111 $ 113
Buildings and leasehold improvements 2,307 2,293
Machinery and equipment 3,981 3,886
Land improvements and other 194 184
Buildings and equipment under construction 218 177
6,811 6,653
Less accumulated depreciation 2,847 2,614
Net property, plant and equipment $3,964 $4,039
The Company’s total depreciation expense was $458 million,
$427 million and $431 million in fiscal years 2004, 2003 and 2002,
respectively. The Company capitalized interest costs of $3 million
in 2004 and 2003, and $9 million in 2002 as part of the cost of
major asset construction projects. Approximately $492 million
will be required to complete construction projects in progress
at October 2, 2004.
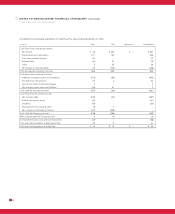
NOTE NINE : OTHER CURRENT LIABILITIES
Other current liabilities at October 2, 2004, and September 27,
2003, include:
in millions 2004 2003
Accrued salaries, wages and benefits $270 $ 263
Self insurance reserves 248 243
Income taxes payable 149 244
Other 343 397
Total other current liabilities $1,010 $1,147