Toyota 2005 Annual Report Download - page 93
Download and view the complete annual report
Please find page 93 of the 2005 Toyota annual report below. You can navigate through the pages in the report by either clicking on the pages listed below, or by using the keyword search tool below to find specific information within the annual report.-
 1
1 -
2
-
3
-
4
-
5
-
6
-
7
-
8
-
9
-
10
-
11
-
12
-
13
-
14
-
15
-
16
-
17
-
18
-
19
-
20
-
21
-
22
-
23
-
24
-
25
-
26
-
27
-
28
-
29
-
30
-
31
-
32
-
33
-
34
-
35
-
36
-
37
-
38
-
39
-
40
-
41
-
42
-
43
-
44
-
45
-
46
-
47
-
48
-
49
-
50
-
51
-
52
-
53
-
54
-
55
-
56
-
57
-
58
-
59
-
60
-
61
-
62
-
63
-
64
-
65
-
66
-
67
-
68
-
69
-
70
-
71
-
72
-
73
-
74
-
75
-
76
-
77
-
78
-
79
-
80
-
81
-
82
-
 83
83 -
 84
84 -
 85
85 -
 86
86 -
 87
87 -
 88
88 -
 89
89 -
 90
90 -
 91
91 -
 92
92 -
 93
93 -
 94
94 -
 95
95 -
 96
96 -
 97
97 -
 98
98 -
 99
99 -
 100
100 -
 101
101 -
 102
102 -
 103
103 -
104
-
105
-
106
-
107
-
108
-
109
-
110
-
111
-
112
-
113
-
114
-
115
-
116
-
117
-
118
-
119
-
120
-
121
-
122
-
123
-
124
-
125
-
126
-
127
-
128
-
129
-
130
-
131
-
132
-
133
-
134
-
135
-
136
-
137
-
138
 |
 |
NOTES TO CONSOLIDATED FINANCIAL STATEMENTS >91
Expected cumulative static pool losses over the life of
the securitizations are calculated by taking actual life to
date losses plus projected losses and dividing the sum by
the original balance of each pool of assets. Expected
cumulative static pool credit losses for the retail loans
securitized for the years ended March 31, 2003, 2004 and
2005 were 0.54%, 0.50%, and 0.47%, respectively.
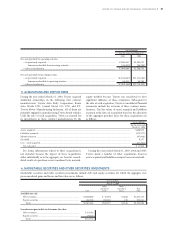
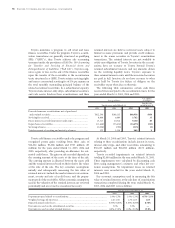
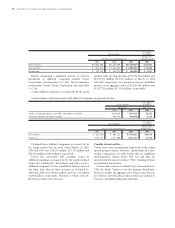
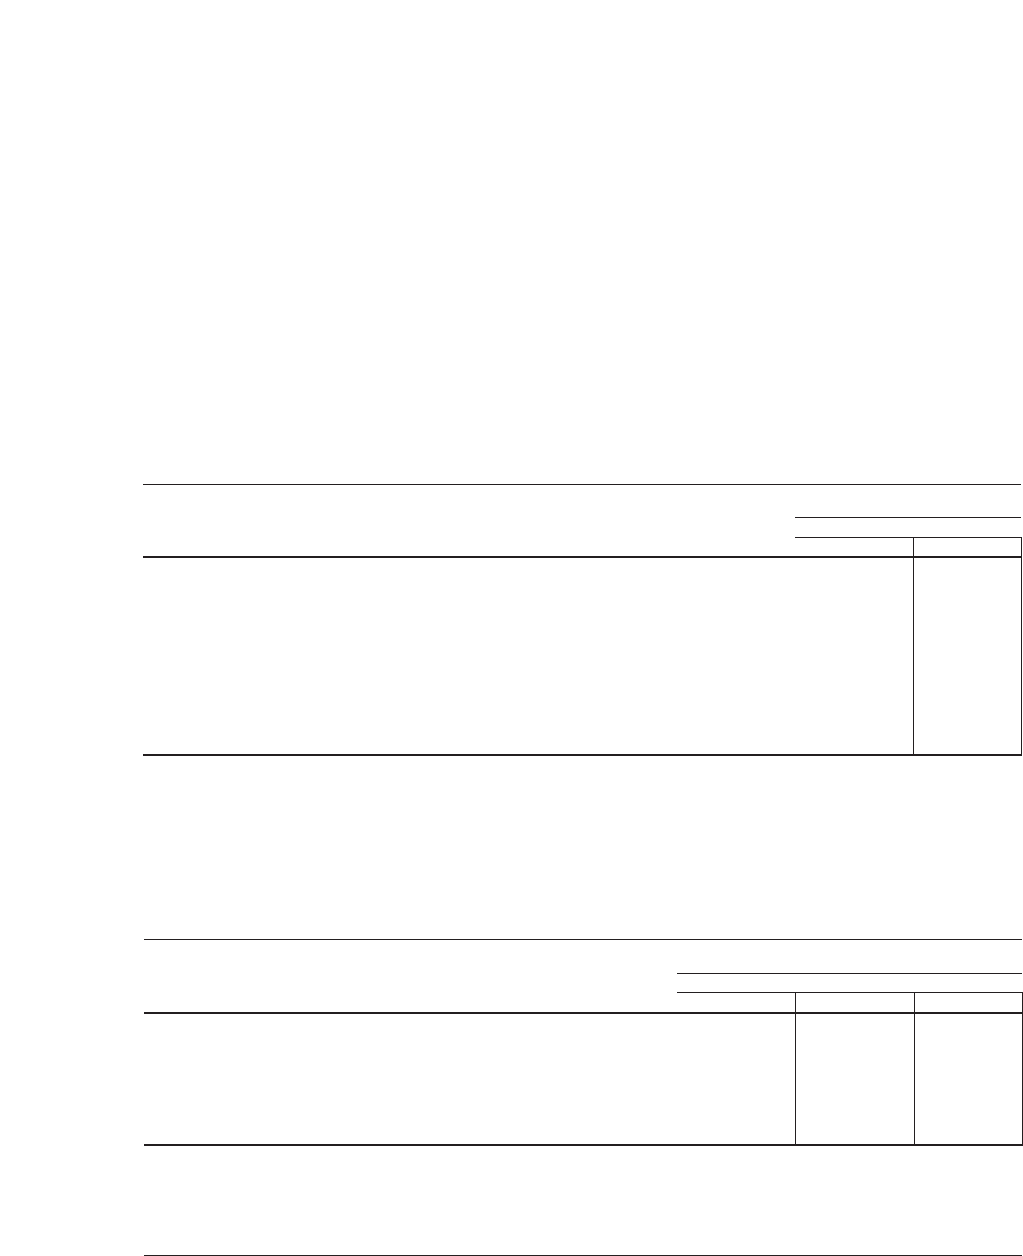
The key economic assumptions and the sensitivity of
the current fair value of the retained interest to an
immediate 10 and 20 percent adverse change in those
economic assumptions are presented below.
U.S. dollars
Yen in millions in millions
March 31, March 31,
2005 2005
Prepayment speed assumption (annual rate) ............................................................................................... 0.7%–1.7%
Impact on fair value of 10% adverse change ............................................................................................ ¥ (861) $ (8)
Impact on fair value of 20% adverse change ............................................................................................ (1,725) (16)
Residual cash flows discount rate (annual rate) ........................................................................................... 5.0%–15.0%
Impact on fair value of 10% adverse change ............................................................................................ ¥ (258) $ (2)
Impact on fair value of 20% adverse change ............................................................................................ (617) (6)
Expected credit losses (annual rate) .............................................................................................................. 0.50%–1.04%
Impact on fair value of 10% adverse change ............................................................................................ ¥(352) $(3)
Impact on fair value of 20% adverse change ............................................................................................ (705) (7)
These hypothetical scenarios do not reflect expected
market conditions and should not be used as a prediction
of future performance. As the figures indicate, changes in
the fair value may not be linear. Also, in this table, the
effect of a variation in a particular assumption on the fair
value of the retained interest is calculated without
changing any other assumption. Actual changes in one
factor may result in changes in another, which might
magnify or counteract the sensitivities. Actual cash flows
may differ from the above analysis.
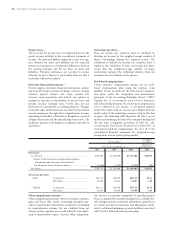
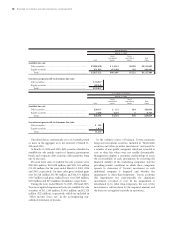
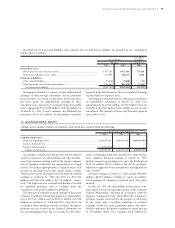
Outstanding receivable balances and delinquency
amounts for managed retail and lease receivables, which
include both owned and securitized receivables, as of March
31, 2004 and 2005 are as follows:
U.S. dollars
Yen in millions in millions
March 31, March 31,
2004 2005 2005
Principal amount outstanding........................................................................................ ¥4,819,938 ¥5,585,672 $52,013
Delinquent amounts over 60 days or more.................................................................... 19,379 23,396 218
Comprised of:
Receivables owned....................................................................................................... ¥4,328,906 ¥5,305,464 $49,404
Receivables securitized................................................................................................ 491,032 280,208 2,609
Credit losses, net of recoveries attributed to managed retail and lease receivables for the years ended March 31, 2004
and 2005 totaled ¥48,011 million and ¥34,455 million ($321 million), respectively.
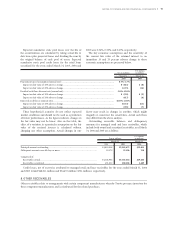
Other receivables relate to arrangements with certain component manufacturers whereby Toyota procures inventory for
these component manufacturers and is reimbursed for the related purchases.
8. OTHER RECEIVABLES