Toyota 2005 Annual Report Download - page 66
Download and view the complete annual report
Please find page 66 of the 2005 Toyota annual report below. You can navigate through the pages in the report by either clicking on the pages listed below, or by using the keyword search tool below to find specific information within the annual report.-
 1
1 -
2
-
3
-
4
-
5
-
6
-
7
-
8
-
9
-
10
-
11
-
12
-
13
-
14
-
15
-
16
-
17
-
18
-
19
-
20
-
21
-
22
-
23
-
24
-
25
-
26
-
27
-
28
-
29
-
30
-
31
-
32
-
33
-
34
-
35
-
36
-
37
-
38
-
39
-
40
-
41
-
42
-
43
-
44
-
45
-
46
-
47
-
48
-
49
-
50
-
51
-
52
-
53
-
54
-
55
-
 56
56 -
 57
57 -
 58
58 -
 59
59 -
 60
60 -
 61
61 -
 62
62 -
 63
63 -
 64
64 -
 65
65 -
 66
66 -
 67
67 -
 68
68 -
 69
69 -
 70
70 -
 71
71 -
 72
72 -
 73
73 -
 74
74 -
 75
75 -
 76
76 -
77
-
78
-
79
-
80
-
81
-
82
-
83
-
84
-
85
-
86
-
87
-
88
-
89
-
90
-
91
-
92
-
93
-
94
-
95
-
96
-
97
-
98
-
99
-
100
-
101
-
102
-
103
-
104
-
105
-
106
-
107
-
108
-
109
-
110
-
111
-
112
-
113
-
114
-
115
-
116
-
117
-
118
-
119
-
120
-
121
-
122
-
123
-
124
-
125
-
126
-
127
-
128
-
129
-
130
-
131
-
132
-
133
-
134
-
135
-
136
-
137
-
138
 |
 |
64 >MANAGEMENT’S DISCUSSION AND ANALYSIS OF FINANCIAL CONDITION AND RESULTS OF OPERATIONS
Net cash outflows from finance receivables relating to
the sale of inventories reported in operating activities in
the consolidated statement of cash flows for the year ended
March 31, 2005 were ¥55.9 billion. See note 4 and 7 to the
consolidated financial statements.
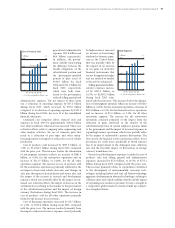
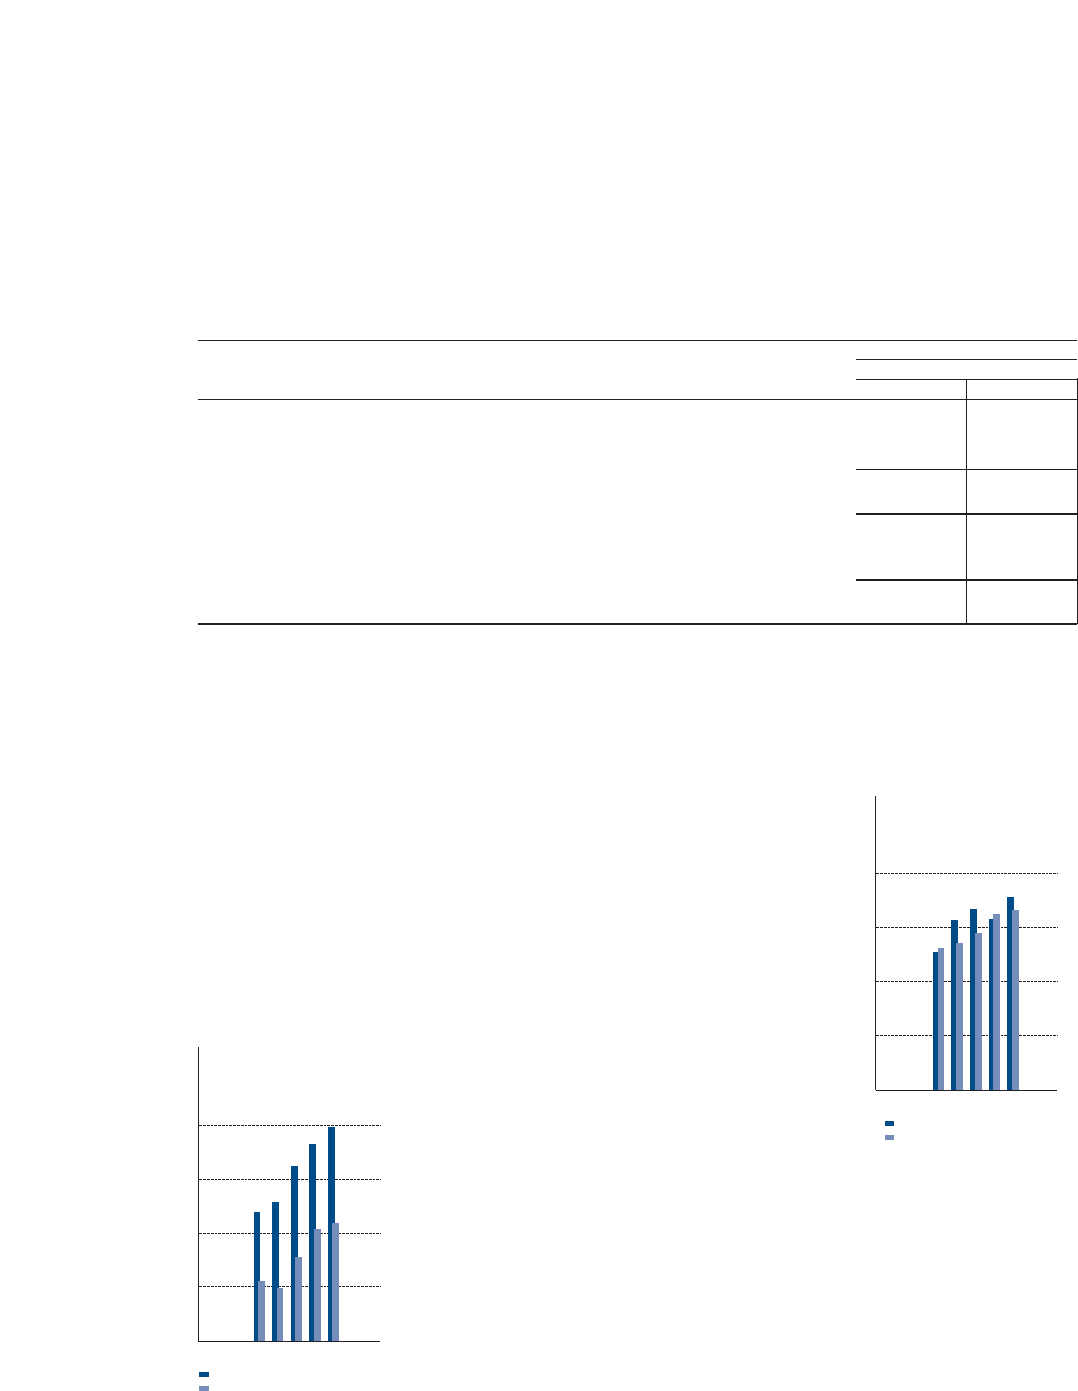
Net cash provided by operating activities was ¥2,370.9
billion for fiscal 2005, compared with ¥2,186.7 billion for
the prior year. The increase in net cash provided by operat-
ing activities resulted primarily from increased operating
cash flows attributed to the growth in business of the
financial services operations.
Net cash used in investing activities was ¥3,061.1 billion
for fiscal 2005, compared with ¥2,216.4 billion for the
prior year. The increase in net cash used in investing
activities resulted primarily from the decrease in sales,
redemptions and maturities of marketable securities and
security investments and an increase in additions of equip-
ment leased to others,
which was partially offset
by decrease in additions
to finance receivables.
Net cash provided by
financing activities was
¥419.3 billion for fiscal
2005, compared with
¥242.2 billion for the prior
year. The increase in net
cash provided by financ-
ing activities resulted pri-
marily from an increase
in long-term debt and a
decrease in purchases of
common stock, which
was partially offset by
increased payments of
short-term borrowings.
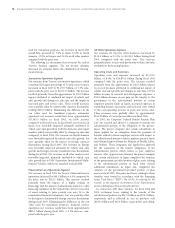
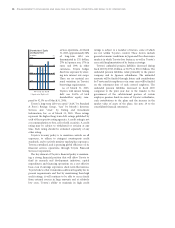
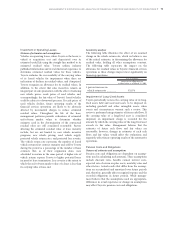
Total capital expenditures for property, plant and equip-
ment, excluding vehicles and equipment on operating
leases, were ¥1,068.2 billion during fiscal 2005, an increase
of 13.0% over the ¥945.8 billion in total capital expendi-
tures for the prior year. The increase in capital expenditures
resulted primarily from
the impact of increased
capital expenditures in
domestic subsidiaries and
overseas capital expendi-
tures for IMV.
Total expenditures for
vehicles and equipment on
operating leases were
¥854.9 billion during fiscal
2005, an increase of 57.5%
over the ¥542.7 billion in
expenditures in the prior
year. The change resulted
primarily from increased
operating lease assets in
finance subsidiaries in
North America and Europe.
Toyota expects invest-
ments in property, plant and equipment, excluding
vehicles leased to others, to approximate ¥1,250.0 billion
during fiscal 2006. Toyota’s expected capital expenditures
include approximately ¥770.0 billion in Japan, ¥220.0
billion in North America, ¥110.0 billion in Europe and
¥150.0 billion in all other areas, respectively.
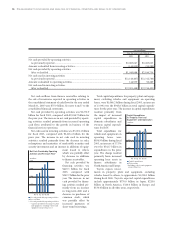
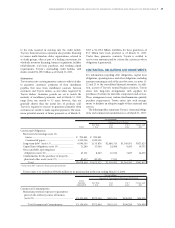
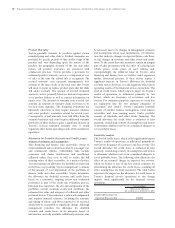
Yen in millions
For the years ended March 31,
2003 2004
Net cash provided by operating activities
As previously reported ........................................................................................................... ¥2,085,047 ¥2,283,023
Amount reclassified from investing activities........................................................................... (144,959) (96,289)
Net cash provided by operating activities
After reclassified...................................................................................................................... ¥1,940,088 ¥2,186,734
Net cash used in investing activities
As previously reported ........................................................................................................... ¥(2,146,407) ¥(2,312,784)
Amount reclassified to operating activities............................................................................... 144,959 96,289
Net cash used in investing activities
After reclassified...................................................................................................................... ¥(2,001,448) ¥(2,216,495)
600
900
300
1,200
’01 ’02 ’03 ’04 ’05
0
Capital Expenditures
for Property, Plant and
Equipment* and Depreciation
(¥ Billion)
FY
Capital expenditures
Depreciation
* Excluding vehicles and equipment
on operating leases
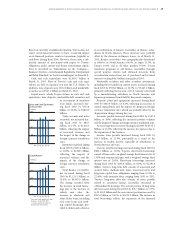
1,200
1,800
600
2,400
’01 ’02 ’03 ’04 ’05
0
Net Cash Provided by Operating
Activities and Free Cash Flow*
(¥ Billion)
FY
Net cash provided by operating activities
Free cash flow
* (Net cash provided by operating activities)
– (Capital expenditures for property, plant
and equipment, excluding vehicles and
equipment on operating leases)