Toyota 2005 Annual Report Download - page 63
Download and view the complete annual report
Please find page 63 of the 2005 Toyota annual report below. You can navigate through the pages in the report by either clicking on the pages listed below, or by using the keyword search tool below to find specific information within the annual report.-
 1
1 -
2
-
3
-
4
-
5
-
6
-
7
-
8
-
9
-
10
-
11
-
12
-
13
-
14
-
15
-
16
-
17
-
18
-
19
-
20
-
21
-
22
-
23
-
24
-
25
-
26
-
27
-
28
-
29
-
30
-
31
-
32
-
33
-
34
-
35
-
36
-
37
-
38
-
39
-
40
-
41
-
42
-
43
-
44
-
45
-
46
-
47
-
48
-
49
-
50
-
51
-
52
-
 53
53 -
 54
54 -
 55
55 -
 56
56 -
 57
57 -
 58
58 -
 59
59 -
 60
60 -
 61
61 -
 62
62 -
 63
63 -
 64
64 -
 65
65 -
 66
66 -
 67
67 -
 68
68 -
 69
69 -
 70
70 -
 71
71 -
 72
72 -
 73
73 -
74
-
75
-
76
-
77
-
78
-
79
-
80
-
81
-
82
-
83
-
84
-
85
-
86
-
87
-
88
-
89
-
90
-
91
-
92
-
93
-
94
-
95
-
96
-
97
-
98
-
99
-
100
-
101
-
102
-
103
-
104
-
105
-
106
-
107
-
108
-
109
-
110
-
111
-
112
-
113
-
114
-
115
-
116
-
117
-
118
-
119
-
120
-
121
-
122
-
123
-
124
-
125
-
126
-
127
-
128
-
129
-
130
-
131
-
132
-
133
-
134
-
135
-
136
-
137
-
138
 |
 |

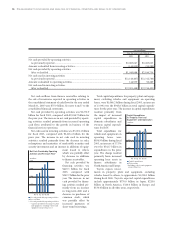
Liabilities, settlement losses relating to the transfer of the
substitutional portion was ¥213.9 billion and is reflected
in cost of products sold (¥190.1 billion) and selling,
general and administrative expenses (¥23.8 billion) for
fiscal 2004. In addition, the government subsidy repre-
senting the difference between the benefit obligations of
the substitutional portion and the government-specified
portion of plan assets of ¥320.9 billion transferred to the
government reduced selling, general and administrative
expenses. The net impact of these items was a reduction of
operating expenses by ¥107.0 billion during fiscal 2004.
See note 19 to the consolidated financial statements.
Continued cost reduction efforts reduced costs and
expenses for fiscal 2004 by approximately ¥230.0 billion
over what would have otherwise been incurred. These cost
reduction efforts relate to ongoing value engineering and
value analysis activities, the use of common parts that
results in a reduction of part types and other manu-
facturing initiatives designed to reduce the costs of vehicle
production.
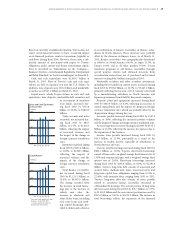
Cost of products sold increased by ¥1,592.1 billion, or
13.4%, to ¥13,506.3 billion during fiscal 2004 compared
with the prior year. This increase (before the elimination
of intersegment amounts) reflects an increase of ¥1,485.3
billion, or 12.9%, for the automotive operations and an
increase of ¥92.5 billion, or 13.8%, for the all other
operations segment. The increase in cost of products sold
for the automotive operations is primarily due to the
combined net impact of increased vehicle unit sales and
changes in sales mix, the consolidation of the results of
subsidiaries previously accounted for on the equity basis,
the impact of increased parts and service sales, the increase
in research and development expenses and settlement loss
on transfer of the substitutional portion of the employee
pension fund that was partially offset by the impact of
continued cost reduction efforts and the impact of foreign
currency translation rates fluctuations during fiscal 2004.
Cost of financing operations decreased by ¥59.7 billion,
or 14.1%, to ¥364.2 billion during fiscal 2004 compared
with the prior year. The decrease resulted primarily from
the impact of gains on derivative financial instruments
that are not designated as hedges and are marked-to-
market at the end of each period, the impact of decreased
interest expenses caused primarily by lower interest rates
in the United States and the impact of fluctuations in
foreign currency translation rates.
The cost of all other operations increased ¥90.3 billion,
or 11.4% during fiscal 2004 compared to the prior year.
The increase results from the increase in net revenues
from Toyota’s other businesses.
Selling, general and administrative expenses (after the
elimination of intersegment amounts) decreased by ¥134.4
billion, or 7.1%, to ¥1,757.4 billion during fiscal 2004
compared with the prior year. This decrease (before the
elimination of intersegment amounts) reflects a decrease of
¥95.0 billion, or 6.0%, for the automotive operations, a
decrease of ¥43.7 billion, or 16.3%, for the financial services
operations and a decrease of ¥2.3 billion, or 1.9%, for the
other operations segment. The decrease for the automotive
operations consisted primarily of the impact of continued
cost reduction efforts, the impact of fluctuations in foreign
currency translation rates and the government subsidy
relating to the transfer of the substitutional portion of
certain employee pension funds that was partially offset by
the impact of increased labor costs arising from the
expansion of operations overseas and increases in advertis-
ing costs. The decrease for the financial services operations
results from lower provisions for credit losses especially in
North America due to an improvement in the delinquent
loan collection rate and the impact of fluctuations in
foreign currency translation rates.
Research and development expenses (included in cost of
products sales and selling, general and administrative
expenses) increased by ¥13.8 billion, or 2.1%, to ¥682.2
billion during fiscal 2004 compared with the prior year, as
a result of the impact of research related to anticipatory,
advanced and environmental technologies with a central
focus on the development of a fuel cell battery and the
impact of expanding new models to promote Toyota’s
strength in a competitive global market for the future.
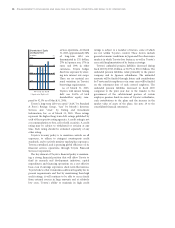
Operating Income
Toyota’s operating income increased by ¥395.2 billion, or
31.1%, to ¥1,666.8 billion during fiscal 2004 compared
with the prior year. Operating income was favorably
affected primarily by vehicle unit sales growth, the impact
of increased parts and service sales, continued cost
reduction efforts, net gains on the transfer of the
substitutional portion of certain employee pension funds
and the consolidation of the results of subsidiaries
previously accounted for on the equity basis. These
increases were partially offset by increases in labor costs
and advertising costs. As a result, operating income as a
percentage of revenue increased to 9.6% for fiscal 2005
compared to 8.2% in the prior years.
MANAGEMENT’S DISCUSSION AND ANALYSIS OF FINANCIAL CONDITION AND RESULTS OF OPERATIONS >61