Toyota 2005 Annual Report Download - page 80
Download and view the complete annual report
Please find page 80 of the 2005 Toyota annual report below. You can navigate through the pages in the report by either clicking on the pages listed below, or by using the keyword search tool below to find specific information within the annual report.-
 1
1 -
2
-
3
-
4
-
5
-
6
-
7
-
8
-
9
-
10
-
11
-
12
-
13
-
14
-
15
-
16
-
17
-
18
-
19
-
20
-
21
-
22
-
23
-
24
-
25
-
26
-
27
-
28
-
29
-
30
-
31
-
32
-
33
-
34
-
35
-
36
-
37
-
38
-
39
-
40
-
41
-
42
-
43
-
44
-
45
-
46
-
47
-
48
-
49
-
50
-
51
-
52
-
53
-
54
-
55
-
56
-
57
-
58
-
59
-
60
-
61
-
62
-
63
-
64
-
65
-
66
-
67
-
68
-
69
-
 70
70 -
 71
71 -
 72
72 -
 73
73 -
 74
74 -
 75
75 -
 76
76 -
 77
77 -
 78
78 -
 79
79 -
 80
80 -
 81
81 -
 82
82 -
 83
83 -
 84
84 -
 85
85 -
 86
86 -
 87
87 -
 88
88 -
 89
89 -
 90
90 -
91
-
92
-
93
-
94
-
95
-
96
-
97
-
98
-
99
-
100
-
101
-
102
-
103
-
104
-
105
-
106
-
107
-
108
-
109
-
110
-
111
-
112
-
113
-
114
-
115
-
116
-
117
-
118
-
119
-
120
-
121
-
122
-
123
-
124
-
125
-
126
-
127
-
128
-
129
-
130
-
131
-
132
-
133
-
134
-
135
-
136
-
137
-
138
 |
 |

78
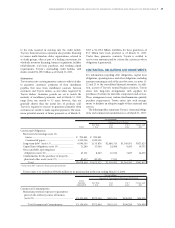
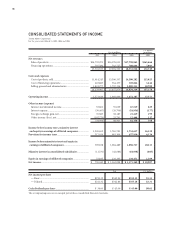
CONSOLIDATED STATEMENTS OF INCOME
Toyota Motor Corporation
For the years ended March 31, 2003, 2004 and 2005
U.S. dollars
Yen in millions in millions
2003 2004 2005 2005
Net revenues
Sales of products ................................................................ ¥14,793,973 ¥16,578,033 ¥17,790,862 $165,666
Financing operations ......................................................... 707,580 716,727 760,664 7,083
15,501,553 17,294,760 18,551,526 172,749
Costs and expenses
Cost of products sold ......................................................... 11,914,245 13,506,337 14,500,282 135,025
Cost of financing operations ............................................. 423,885 364,177 369,844 3,444
Selling, general and administrative ................................... 1,891,777 1,757,356 2,009,213 18,709
14,229,907 15,627,870 16,879,339 157,178
Operating income ................................................................. 1,271,646 1,666,890 1,672,187 15,571
Other income (expense)
Interest and dividend income............................................ 52,661 55,629 67,519 629
Interest expense.................................................................. (30,467) (20,706) (18,956) (177)
Foreign exchange gain, net ................................................ 35,585 38,187 21,419 199
Other income (loss), net.................................................... (102,773) 25,793 12,468 117
(44,994) 98,903 82,450 768
Income before income taxes, minority interest
and equity in earnings of affiliated companies ................ 1,226,652 1,765,793 1,754,637 16,339
Provision for income taxes................................................... 517,014 681,304 657,910 6,126
Income before minority interest and equity in
earnings of affiliated companies........................................ 709,638 1,084,489 1,096,727 10,213
Minority interest in consolidated subsidiaries .................. (11,531) (42,686) (64,938) (605)
Equity in earnings of affiliated companies......................... 52,835 120,295 139,471 1,299
Net income............................................................................. ¥ 750,942 ¥ 1,162,098 ¥ 1,171,260 $ 10,907
Yen U.S. dollars
Net income per share
— Basic............................................................................... ¥211.32 ¥342.90 ¥355.35 $3.31
— Diluted........................................................................... ¥211.32 ¥342.86 ¥355.28 $3.31
Cash dividends per share ..................................................... ¥ 36.00 ¥ 45.00 ¥ 65.00 $0.61
The accompanying notes are an integral part of these consolidated financial statements.