Toyota 2005 Annual Report Download - page 16
Download and view the complete annual report
Please find page 16 of the 2005 Toyota annual report below. You can navigate through the pages in the report by either clicking on the pages listed below, or by using the keyword search tool below to find specific information within the annual report.-
 1
1 -
2
-
3
-
4
-
5
-
 6
6 -
 7
7 -
 8
8 -
 9
9 -
 10
10 -
 11
11 -
 12
12 -
 13
13 -
 14
14 -
 15
15 -
 16
16 -
 17
17 -
 18
18 -
 19
19 -
 20
20 -
 21
21 -
 22
22 -
 23
23 -
 24
24 -
 25
25 -
 26
26 -
27
-
28
-
29
-
30
-
31
-
32
-
33
-
34
-
35
-
36
-
37
-
38
-
39
-
40
-
41
-
42
-
43
-
44
-
45
-
46
-
47
-
48
-
49
-
50
-
51
-
52
-
53
-
54
-
55
-
56
-
57
-
58
-
59
-
60
-
61
-
62
-
63
-
64
-
65
-
66
-
67
-
68
-
69
-
70
-
71
-
72
-
73
-
74
-
75
-
76
-
77
-
78
-
79
-
80
-
81
-
82
-
83
-
84
-
85
-
86
-
87
-
88
-
89
-
90
-
91
-
92
-
93
-
94
-
95
-
96
-
97
-
98
-
99
-
100
-
101
-
102
-
103
-
104
-
105
-
106
-
107
-
108
-
109
-
110
-
111
-
112
-
113
-
114
-
115
-
116
-
117
-
118
-
119
-
120
-
121
-
122
-
123
-
124
-
125
-
126
-
127
-
128
-
129
-
130
-
131
-
132
-
133
-
134
-
135
-
136
-
137
-
138
 |
 |

14
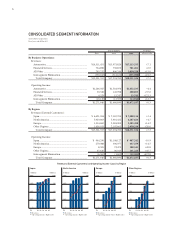
Performance Overview
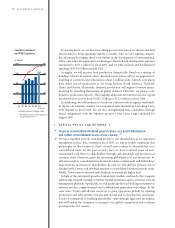
In fiscal 2005, ended March 31, 2005, Toyota posted record results across the board, with
increases of 7.3% in consolidated net revenues, to ¥18.55 trillion; 0.3% in operating
income, to ¥1.67 trillion; and 0.8% in net income, to ¥1.17 trillion. Among those results,
operating income remained at the previous fiscal year’s high level, absorbing such
income-reducing factors as ¥140.0 billion for the effect of currency exchange rate changes
and a ¥59.8 billion decrease in net gains on the transfer of the substitutional portion of
the employee pension funds to the government. Further, net income was above ¥1 trillion
for the second consecutive year.
I believe that we were able to maintain high annual earnings while investing for future
growth. Toyota has been able to realize long-term growth by continuously evolving the
quality of its business strategy. To establish a foundation for further growth, the
Company believes that it is critical to develop market-creating products while increasing
self-reliance of overseas operations by making capital expenditures to advance global
operations worldwide and to build research and development. We aim to heighten
management efficiency through the creation of a more balanced profit structure among
the four regions: Japan, North America, Europe, and Other Regions including Asia.
Financial Strategy
The three key strategies of Toyota’s financial strategy are “growth,” “efficiency,” and
“stability.” In other words, our financial strategy is founded on continued forward-
looking investment for growth, the enhancement of profitability and capital efficiency, and
the maintenance of a solid financial position. In the medium-to-long term, Toyota will
balance its pursuit of those three priorities to achieve steady and sustainable growth.
Regarding “growth,” I believe we have to continue investing effectively, regardless of
such factors as currency exchange rate fluctuations and corporate performance. It is
essential to implement capital expenditures for operations worldwide as well as prior
investment in environmental and safety technologies, which will become the key drivers
of sustainable growth. Further, our management policy emphasizes cash flows in order to
steadily raise corporate value for our shareholders. Guided by that policy, in fiscal 2005
Toyota was able to maintain positive free cash flow while implementing investments in
property, plant and equipment of more than ¥1 trillion (excluding vehicles and
equipment on operating leases) and recording approximately ¥750 billion in research and
development expenses. In fiscal 2006, aiming to realize further growth through effective
investment, we will continue to earmark free cash flow generated through our efforts
to maximize earnings for stepped-up investment in property, plant and equipment
and in research and development.
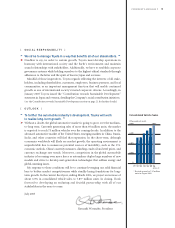
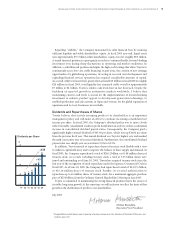
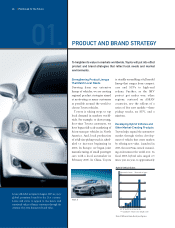
Regarding “efficiency” in fiscal 2005, the Company recorded an operating income
margin of 9.0% and ROE of 13.6%. In comparison with fiscal 2000’s operating income
margin of 5.6% and ROE of 7.1%, the Company achieved substantial improvement, and
has balanced both “growth” and “efficiency.” In order to advance cost reduction activities,
—one of Toyota’s perennial strengths—the Company has launched the “VI Activity,” in
pursuit of “value innovation” and strives to promote cost reduction on a new level.
Toyota is making a concerted effort to take profitability and efficiency to new heights.
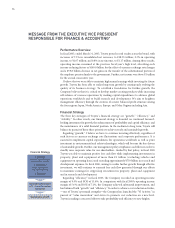
Financial Strategy
1. Growth
Continue forward-looking
investment for growth
2. Efficiency
Enhance profitability
and capital efficiency
3. Stability
Maintain solid financial base
Balanced implementation
of 1. – 3. over the medium
to long term
Sustainable growth
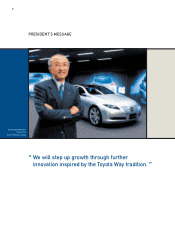
MESSAGE FROM THE EXECUTIVE VICE PRESIDENT
RESPONSIBLE FOR FINANCE & ACCOUNTING*