Toyota 2005 Annual Report Download - page 53
Download and view the complete annual report
Please find page 53 of the 2005 Toyota annual report below. You can navigate through the pages in the report by either clicking on the pages listed below, or by using the keyword search tool below to find specific information within the annual report.-
 1
1 -
2
-
3
-
4
-
5
-
6
-
7
-
8
-
9
-
10
-
11
-
12
-
13
-
14
-
15
-
16
-
17
-
18
-
19
-
20
-
21
-
22
-
23
-
24
-
25
-
26
-
27
-
28
-
29
-
30
-
31
-
32
-
33
-
34
-
35
-
36
-
37
-
38
-
39
-
40
-
41
-
42
-
 43
43 -
 44
44 -
 45
45 -
 46
46 -
 47
47 -
 48
48 -
 49
49 -
 50
50 -
 51
51 -
 52
52 -
 53
53 -
 54
54 -
 55
55 -
 56
56 -
 57
57 -
 58
58 -
 59
59 -
 60
60 -
 61
61 -
 62
62 -
 63
63 -
64
-
65
-
66
-
67
-
68
-
69
-
70
-
71
-
72
-
73
-
74
-
75
-
76
-
77
-
78
-
79
-
80
-
81
-
82
-
83
-
84
-
85
-
86
-
87
-
88
-
89
-
90
-
91
-
92
-
93
-
94
-
95
-
96
-
97
-
98
-
99
-
100
-
101
-
102
-
103
-
104
-
105
-
106
-
107
-
108
-
109
-
110
-
111
-
112
-
113
-
114
-
115
-
116
-
117
-
118
-
119
-
120
-
121
-
122
-
123
-
124
-
125
-
126
-
127
-
128
-
129
-
130
-
131
-
132
-
133
-
134
-
135
-
136
-
137
-
138
 |
 |
51
MANAGEMENT’S DISCUSSION AND ANALYSIS OF FINANCIAL
CONDITION AND RESULTS OF OPERATIONS
All financial information discussed in this section is
derived from Toyota’s consolidated financial statements
that appear elsewhere in this annual report on Form 20-F.
The financial statements have been prepared in confor-
mity with accounting principles generally accepted in
the United States of America.
OVERVIEW
The business segments of Toyota Motor Corporation
(“the parent company”) and its subsidiaries (collectively,
“Toyota”) include automotive operations, financial services
operations and all other operations. Automotive opera-
tions is Toyota’s most significant business segment,
accounting for 90% of Toyota’s total revenues before the
elimination of intersegment revenues and 86% of Toyota’s
total operating income before the elimination of interseg-
ment revenues and costs for the year ended March 31,
2005. The operating income from automotive operations
as a percentage of total operating income decreased by 4%
due to an increase in operating income from the financial
services operations. Toyota’s primary markets based on
vehicle unit sales for the year ended March 31, 2005 were:
Japan (32%), North America (31%) and Europe (13%).
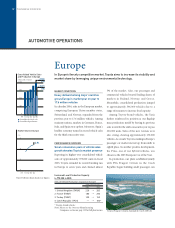
Automotive Market Environment
The worldwide automotive market is highly competitive
and volatile. The demand for automobiles is affected by a
number of factors including social, political and general
economic conditions; introduction of new vehicles and
technologies; and costs incurred by customers to purchase
and operate vehicles. These factors can cause consumer
demand to vary substantially from year to year in different
geographic markets and for different types of automobiles.
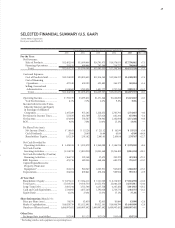
The following table sets forth Toyota’s consolidated
vehicle unit sales by geographical market for the past three
fiscal years.
Thousands of units
Year Ended March 31,
2003 2004 2005
Japan................................. 2,217 2,303 2,381
North America................. 1,982 2,103 2,271
Europe.............................. 776 898 979
All Other Markets............ 1,138 1,415 1,777
Overseas Total.................. 3,896 4,416 5,027
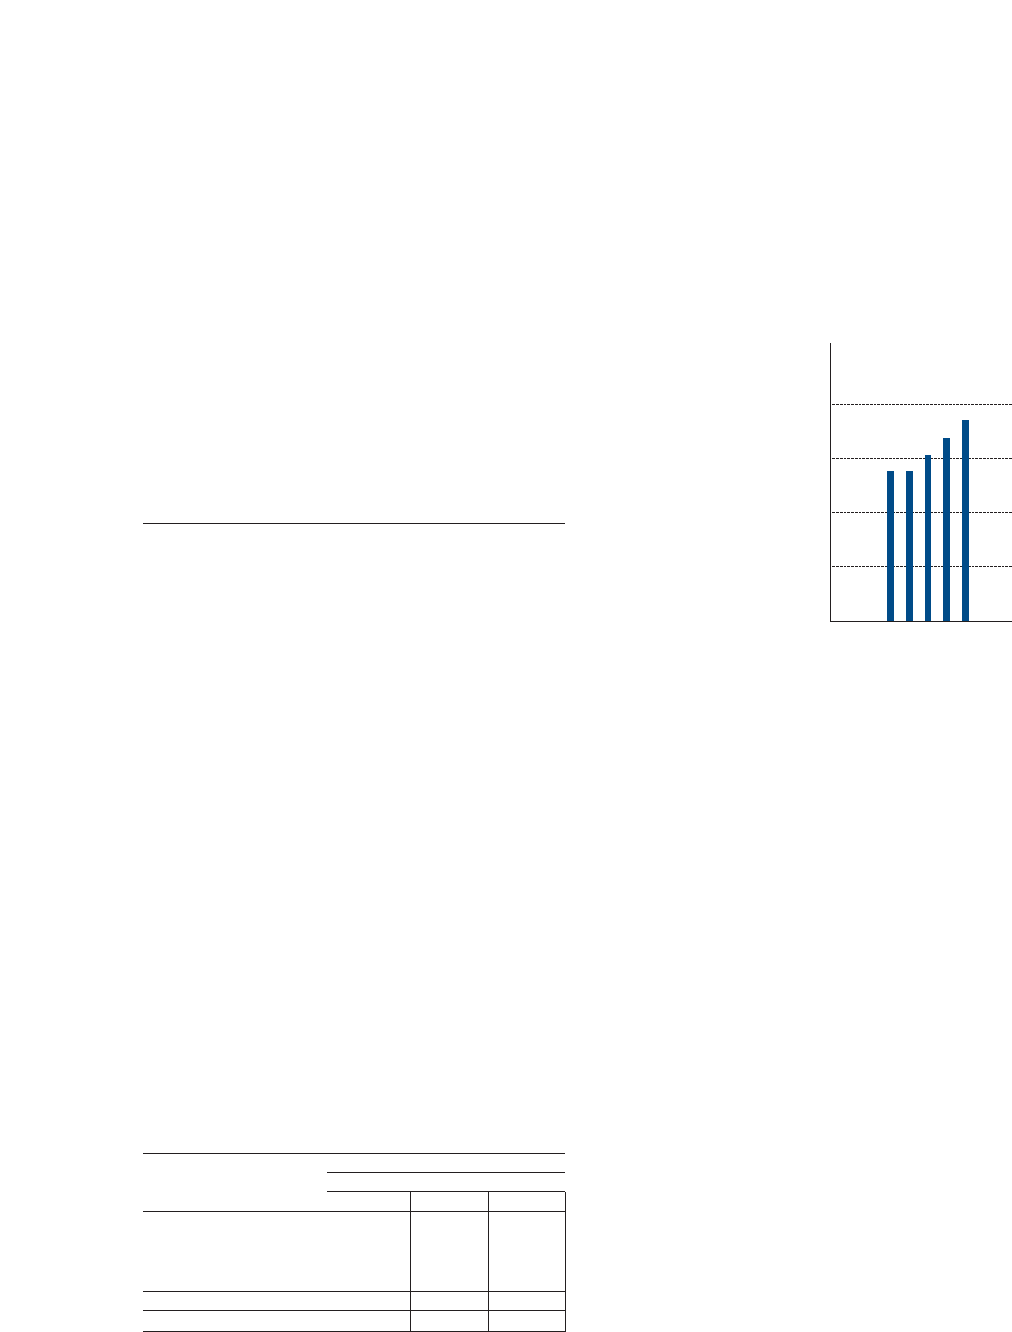
Total ................................. 6,113 6,719 7,408
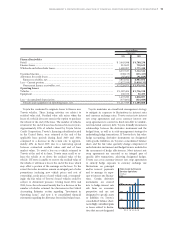
Toyota’s consolidated unit sales in Japan increased
during both fiscal 2004 and 2005 as compared to the prior
year as the result of the active introduction of new products
that met customer needs and the strong sales efforts of
domestic dealers despite a decline in the overall domestic
market in each of those years. In addition, overseas vehicle
unit sales increased in North America, Europe and all other
markets due to extensive product offerings that catered to
regional needs during fiscal 2004 and 2005.
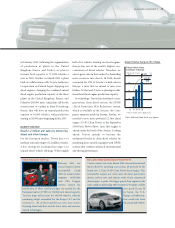
Toyota’s share of total vehicle
unit sales in each market is
influenced by the quality,
price, design, performance,
safety, reliability, economy
and utility of Toyota’s
vehicles compared with those
offered by other manufac-
turers. The timely introduc-
tion of new or redesigned
vehicles is also an important
factor in satisfying customer
demand. Toyota’s ability to
satisfy changing customer pre-
ferences can affect its
rev-
enues and earnings significantly.
The profitability of Toyota’s automotive operations is
affected by many factors. These factors include:
•vehicle unit sales volumes,
•the mix of vehicle models and options sold,
•the level of parts and service sales,
•the levels of price discounts and other sales incentives
and marketing costs,
•the cost of customer warranty claims and other
customer satisfaction actions,
•the cost of research and development and other fixed costs,
•the ability to control costs,
•the efficient use of production capacity, and
•changes in the value of the Japanese yen and other
currencies in which Toyota does business.
Changes in laws, regulations, policies and other govern-
mental actions can also materially impact the profitability
of Toyota’s automotive operations. These laws, regulations
and policies include those attributed to environmental
matters and vehicle safety, fuel economy and emissions
that can add significantly to the cost of vehicles. The
European Union has approved a directive that requires
manufacturers to be financially responsible for taking back
end-of-life vehicles and to take measures to ensure that
adequate used vehicle disposal facilities are established and
that hazardous materials and recyclable parts are removed
from vehicles prior to scrapping. Please see “— Legislation
Regarding End-of-Life Vehicles” and “Information on the
Company—Business Overview—Governmental Regulation,
Environmental and Safety Standards” in Toyota’s annual
report on Form 20-F and note 23 to the consolidated
financial statements for a more detailed discussion of
these laws, regulations and policies.
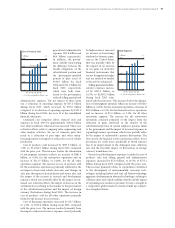
4,000
2,000
6,000
8,000
’01 ’02 ’03 ’04 ’05
0
FY
Consolidated Vehicle Sales
(Thousands of units)