Toyota 2005 Annual Report Download - page 64
Download and view the complete annual report
Please find page 64 of the 2005 Toyota annual report below. You can navigate through the pages in the report by either clicking on the pages listed below, or by using the keyword search tool below to find specific information within the annual report.-
 1
1 -
2
-
3
-
4
-
5
-
6
-
7
-
8
-
9
-
10
-
11
-
12
-
13
-
14
-
15
-
16
-
17
-
18
-
19
-
20
-
21
-
22
-
23
-
24
-
25
-
26
-
27
-
28
-
29
-
30
-
31
-
32
-
33
-
34
-
35
-
36
-
37
-
38
-
39
-
40
-
41
-
42
-
43
-
44
-
45
-
46
-
47
-
48
-
49
-
50
-
51
-
52
-
53
-
 54
54 -
 55
55 -
 56
56 -
 57
57 -
 58
58 -
 59
59 -
 60
60 -
 61
61 -
 62
62 -
 63
63 -
 64
64 -
 65
65 -
 66
66 -
 67
67 -
 68
68 -
 69
69 -
 70
70 -
 71
71 -
 72
72 -
 73
73 -
 74
74 -
75
-
76
-
77
-
78
-
79
-
80
-
81
-
82
-
83
-
84
-
85
-
86
-
87
-
88
-
89
-
90
-
91
-
92
-
93
-
94
-
95
-
96
-
97
-
98
-
99
-
100
-
101
-
102
-
103
-
104
-
105
-
106
-
107
-
108
-
109
-
110
-
111
-
112
-
113
-
114
-
115
-
116
-
117
-
118
-
119
-
120
-
121
-
122
-
123
-
124
-
125
-
126
-
127
-
128
-
129
-
130
-
131
-
132
-
133
-
134
-
135
-
136
-
137
-
138
 |
 |

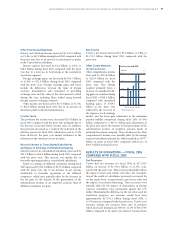
62 >MANAGEMENT’S DISCUSSION AND ANALYSIS OF FINANCIAL CONDITION AND RESULTS OF OPERATIONS
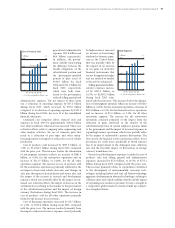
During fiscal 2004, operating income (before the
elimination of intersegment profits) increased by ¥163.8
billion, or 17.4%, in Japan, ¥111.0 billion, or 39.6%, in
North America, ¥64.2 billion, or 772.7% in Europe and
¥51.3 billion, or 112.4% in all other markets compared
with the prior year. The increase in Japan relates primarily
to the impact of increased production volume and vehicle
unit sales, continued cost reduction efforts, the impact of
the net gains on the transfer of the substitutional portion
of certain employee funds and the consolidation of the
results of subsidiaries previously accounted for on the
equity basis. These increases were partially offset by the
impact of fluctuations in foreign currency translation rates
against Toyota’s non-domestic sales produced in Japan.
The increase in North America relates primarily to the
increase in production volume and vehicle unit sales,
the impact of cost reduction efforts of manufacturing
companies, lower provisions for credit losses and the
impact of unrealized gains on interest rate swaps held by
sales financing subsidiaries, that were partially offset by the
negative impact of the exchange rate of the yen against the
U.S. dollar. The increase in the European market relates
mainly to the impact of cost reduction efforts of manu-
facturing companies, an increase in production volume and
vehicle unit sales, the impact of changes in sales mix and a
favorable exchange rate of the yen against the Euro, that
was partially offset by the increase in labor costs due to the
expansion of operations. The increase in other markets
relates primarily to the impact of the increase in production
volume and vehicle unit sales mainly in Asia and a general
improvement in other markets.
The following is a discussion of operating income for
each of Toyota’s business segments. The operating income
amounts discussed are before the elimination of interseg-
ment profits.
Automotive Operations Segment
Operating income from Toyota’s automotive operations
increased by ¥272.1 billion, or 21.8%, to ¥1,519.0 billion
during fiscal 2004 compared with the prior year.
Operating income was favorably affected primarily by the
increase in vehicle unit sales, the increase in parts and
service sales, the impact of continued cost reduction
efforts, net gains on the transfer of the substitutional
portion of certain employee pension funds, the consolida-
tion of the results of subsidiaries previously accounted for
on the equity basis, and the favorable exchange rate
fluctuations of the yen against the euro. These increases
were partially offset by increases in labor costs and
advertising expenses, and the unfavorable exchange rate
fluctuations of the yen against the U.S. dollar.
Financial Services Operations Segment
Operating income from Toyota’s financial services opera-
tions increased by ¥115.7 billion, or 381.4%, to ¥146.0
billion during fiscal 2004 compared with the prior year.
This increase was primarily due to the impact of gains on
derivative financial instruments, lower provisions for credit
losses, an increase in the finance receivables asset base, the
decrease in interest expenses attributed to lower interest
rates on borrowings in the United States and the increase in
the number of credit cards issued in Japan. These increases
were partially offset by the unfavorable fluctuations in the
U.S. dollar exchange rate against the yen.
All Other Operations Segment
Operating income from Toyota’s other businesses increased
by ¥10.7 billion, or 236.7% to ¥15.2 billion during fiscal
2004. This increase primarily relates to increased revenue
from the prefabricated housing business.
Other Income and Expenses
Interest and dividend income increased by ¥3.0 billion, or
5.6%, to ¥55.6 billion during fiscal 2004 compared with
the prior year due to an increase in investment securities
in the United States subsidiary, which was partially offset
by lower interest rates in the United States.
Interest expense decreased by ¥9.8 billion, or 32.0%, to
¥20.7 billion during fiscal 2004 compared with the prior
year due to a decrease in borrowings in the automotive
segment and lower interest rates in the United States.
Foreign exchange gain, net increased by ¥2.6 billion, or
7.3%, to ¥38.2 billion during fiscal 2004 compared with
the prior year. Foreign exchange gain and loss include the
differences between the value of foreign currency
denominated sales translated at prevailing exchange rates
and the value of the sales amounts settled during the year,
including those settled using forward foreign currency
exchange contracts.
Other gain and loss changed to a gain of ¥25.8 billion
from a loss of ¥102.8 billion in the prior year. During fiscal
2003, there were losses of ¥111.3 billion relating to other-
than temporary impairments on investment securities.
During fiscal 2004, there were no material impairments on
investment securities primarily attributed to the more
favorable stock market conditions in Japan.