Toyota 2005 Annual Report Download - page 109
Download and view the complete annual report
Please find page 109 of the 2005 Toyota annual report below. You can navigate through the pages in the report by either clicking on the pages listed below, or by using the keyword search tool below to find specific information within the annual report.-
 1
1 -
2
-
3
-
4
-
5
-
6
-
7
-
8
-
9
-
10
-
11
-
12
-
13
-
14
-
15
-
16
-
17
-
18
-
19
-
20
-
21
-
22
-
23
-
24
-
25
-
26
-
27
-
28
-
29
-
30
-
31
-
32
-
33
-
34
-
35
-
36
-
37
-
38
-
39
-
40
-
41
-
42
-
43
-
44
-
45
-
46
-
47
-
48
-
49
-
50
-
51
-
52
-
53
-
54
-
55
-
56
-
57
-
58
-
59
-
60
-
61
-
62
-
63
-
64
-
65
-
66
-
67
-
68
-
69
-
70
-
71
-
72
-
73
-
74
-
75
-
76
-
77
-
78
-
79
-
80
-
81
-
82
-
83
-
84
-
85
-
86
-
87
-
88
-
89
-
90
-
91
-
92
-
93
-
94
-
95
-
96
-
97
-
98
-
 99
99 -
 100
100 -
 101
101 -
 102
102 -
 103
103 -
 104
104 -
 105
105 -
 106
106 -
 107
107 -
 108
108 -
 109
109 -
 110
110 -
 111
111 -
 112
112 -
 113
113 -
 114
114 -
 115
115 -
 116
116 -
 117
117 -
 118
118 -
 119
119 -
120
-
121
-
122
-
123
-
124
-
125
-
126
-
127
-
128
-
129
-
130
-
131
-
132
-
133
-
134
-
135
-
136
-
137
-
138
 |
 |

NOTES TO CONSOLIDATED FINANCIAL STATEMENTS >107
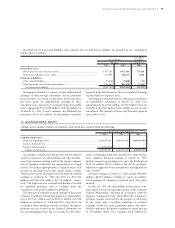
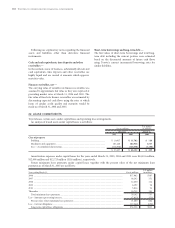
The following pension benefit payments, which reflect expected future service, as appropriate, are expected to be paid:
U.S. dollars
Years ending March 31, Yen in millions in millions
2006 ................................................................................................................................................................. ¥72,184 $672
2007 ................................................................................................................................................................. 78,137 728
2008 ................................................................................................................................................................. 77,379 721
2009 ................................................................................................................................................................. 79,998 745
2010 ................................................................................................................................................................. 79,568 741
from 2011 to 2015........................................................................................................................................... 388,551 3,617
Total ............................................................................................................................................................ 775,817 7,224
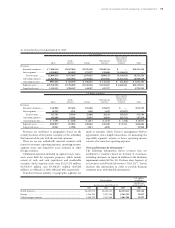
The expected rate of return on plan assets is determined
after considering several applicable factors including, the
composition of plan assets held, assumed risks of asset
management, historical results of the returns on plan
assets, Toyota’s principal policy for plan asset manage-
ment, and forecasted market conditions.
Toyota’s policy and objective for plan asset manage-
ment is to maximize returns on plan assets to meet future
benefit payment requirements under risks which Toyota
considers permissible. Asset allocations under the plan
asset management are determined based on Toyota’s plan
asset management guidelines which are established to
achieve the optimized asset compositions in terms of the
long-term overall plan asset management. Prior to making
individual investments, Toyota performs in-depth assess-
ments of corresponding factors including risks, transac-
tion costs and liquidity of each potential investment under
consideration. To measure the performance of the plan
asset management, Toyota establishes bench mark return
rates for each individual investment, combines these
individual bench mark rates based on the asset composi-
tion ratios within each asset category, and compares the
combined rates with the corresponding actual return rates
on each asset category.
Toyota expects to contribute ¥83,862 million ($781
million) to its pension plan in the year ending March 31,
2006.
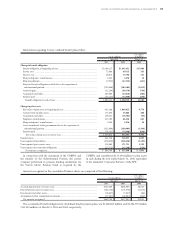
Toyota’s pension plan weighted-average asset allocations as of March 31, 2004 and 2005, by asset category are as follows:
Plan assets at March 31,
2004 2005
Equity securities................................................................................................................................................. 49.4% 64.0%
Debt securities.................................................................................................................................................... 16.9 21.5
Real estate........................................................................................................................................................... 0.3 0.5
Other .................................................................................................................................................................. 33.4 14.0
Total............................................................................................................................................................... 100.0% 100.0%
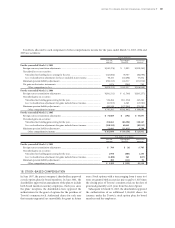
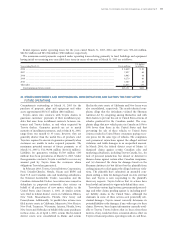
Weighted-average assumptions used to determine net periodic pension cost for the years ended March 31, 2003, 2004
and 2005 are as follows:
For the years ended March 31,
2003 2004 2005
Discount rate.......................................................................................................................... 2.5% 2.1% 2.2%
Expected return on plan assets ............................................................................................. 2.7% 2.1% 2.1%
Rate of compensation increase ............................................................................................. 1.5–6.0% 0.8–9.7% 0.5–9.7%