Toyota 2005 Annual Report Download - page 51
Download and view the complete annual report
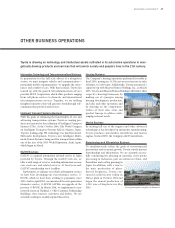
Please find page 51 of the 2005 Toyota annual report below. You can navigate through the pages in the report by either clicking on the pages listed below, or by using the keyword search tool below to find specific information within the annual report.-
 1
1 -
2
-
3
-
4
-
5
-
6
-
7
-
8
-
9
-
10
-
11
-
12
-
13
-
14
-
15
-
16
-
17
-
18
-
19
-
20
-
21
-
22
-
23
-
24
-
25
-
26
-
27
-
28
-
29
-
30
-
31
-
32
-
33
-
34
-
35
-
36
-
37
-
38
-
39
-
40
-
 41
41 -
 42
42 -
 43
43 -
 44
44 -
 45
45 -
 46
46 -
 47
47 -
 48
48 -
 49
49 -
 50
50 -
 51
51 -
 52
52 -
 53
53 -
 54
54 -
 55
55 -
 56
56 -
 57
57 -
 58
58 -
 59
59 -
 60
60 -
 61
61 -
62
-
63
-
64
-
65
-
66
-
67
-
68
-
69
-
70
-
71
-
72
-
73
-
74
-
75
-
76
-
77
-
78
-
79
-
80
-
81
-
82
-
83
-
84
-
85
-
86
-
87
-
88
-
89
-
90
-
91
-
92
-
93
-
94
-
95
-
96
-
97
-
98
-
99
-
100
-
101
-
102
-
103
-
104
-
105
-
106
-
107
-
108
-
109
-
110
-
111
-
112
-
113
-
114
-
115
-
116
-
117
-
118
-
119
-
120
-
121
-
122
-
123
-
124
-
125
-
126
-
127
-
128
-
129
-
130
-
131
-
132
-
133
-
134
-
135
-
136
-
137
-
138
 |
 |
49
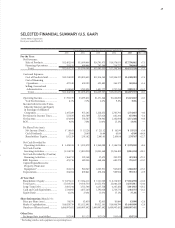
SELECTED FINANCIAL SUMMARY (U.S. GAAP)
Toyota Motor Corporation
Fiscal years ended March 31
Yen in millions except per share data, share information, and other data % change
2001 2002 2003 2004 2005
2004 vs 2005
For the Year:
Net Revenues:
Sales of Products ......................
¥12,402,104 ¥13,499,644 ¥14,793,973 ¥16,578,033 ¥17,790,862 +7.3
Financing Operations ..............
553,133 690,664 707,580 716,727 760,664 +6.1
Total......................................
¥12,955,237 ¥14,190,308 ¥15,501,553 ¥17,294,760 ¥18,551,526 +7.3
Costs and Expenses:
Cost of Products Sold ..............
¥10,218,599 ¥10,874,455 ¥11,914,245 ¥13,506,337 ¥14,500,282 +7.4
Cost of Financing
Operations...............................
427,340 459,195 423,885 364,177 369,844 +1.6
Selling, General and
Administrative........................
1,518,569 1,763,026 1,891,777 1,757,356 2,009,213 +14.3
Total......................................
¥12,164,508 ¥13,096,676 ¥14,229,907 ¥15,627,870 ¥16,879,339 +8.0
Operating Income........................
¥ 790,729 ¥1,093,632 ¥1,271,646 ¥1,666,890 ¥1,672,187 +0.3
% of Net Revenues ...................
6.1% 7.7% 8.2% 9.6% 9.0% —
Income before Income Taxes,
Minority Interest and Equity
in Earnings of Affiliated
Companies..................................
1,107,289 972,101 1,226,652 1,765,793 1,754,637 –0.6
Provision for Income Taxes.........
523,876 422,789 517,014 681,304 657,910 –3.4
Net Income...................................
674,898 556,567 750,942 1,162,098 1,171,260 +0.8
ROE...............................................
9.6% 7.8% 10.4% 15.2% 13.6% —
Per Share Data (yen):
Net Income (Basic) ..................
¥ 180.65 ¥ 152.26 ¥ 211.32 ¥ 342.90 ¥ 355.35 +3.6
Cash Dividends ........................
25.00 28.00 36.00 45.00 65.00 +44.4
Shareholders’ Equity ................
1,921.29 2,015.82 2,063.43 2,456.08 2,767.67 +12.7
Net Cash Provided by
Operating Activities ...................
¥ 1,428,018 ¥ 1,532,079 ¥ 1,940,088 ¥ 2,186,734 ¥ 2,370,940 +8.4
Net Cash Used in
Investing Activities.....................
(1,318,738) (1,810,230) (2,001,448) (2,216,495) (3,061,196) +38.1
Net Cash Provided by (Used in)
Financing Activities....................
(166,713) 392,148 37,675 242,223 419,384 +73.1
R&D Expenses..............................
475,716 589,306 668,404 682,279 755,147 +10.7
Capital Expenditures for
Property, Plant and
Equipment* ................................
762,274 940,547 1,005,931 945,803 1,068,287 +13.0
Depreciation.................................
784,784 809,841 870,636 969,904 997,713 +2.9
At Year-End:
Shareholders’ Equity ....................
¥ 7,077,411 ¥ 7,264,112 ¥ 7,121,000 ¥ 8,178,567 ¥ 9,044,950 +10.6
Total Assets...................................
17,019,783 19,305,730 20,152,974 22,040,228 24,335,011 +10.4
Long-Term Debt ..........................
3,083,344 3,722,706 4,137,528 4,247,266 5,014,925 +18.1
Cash and Cash Equivalents..........
1,510,892 1,657,160 1,592,028 1,729,776 1,483,753 –14.2
Equity Ratio..................................
41.6% 37.6% 35.3% 37.1% 37.2% —
Share Information (March 31):
Price per Share (yen)....................
¥4,350 ¥3,650 ¥2,635 ¥3,880 ¥3,990 +2.8
Market Capitalization ..................
¥16,029,739 ¥13,332,491 ¥9,512,343 ¥14,006,790 ¥14,403,890 +2.8
Number of Shares Issued.............
3,684,997,492 3,649,997,492 3,609,997,492 3,609,997,492 3,609,997,492 —
Other Data:
Exchange Rate (yen/dollar) .........
¥123.90 ¥133.25 ¥120.20 ¥105.69 ¥107.39
* Excluding vehicles and equipment on operating leases