Toyota 2005 Annual Report Download - page 6
Download and view the complete annual report
Please find page 6 of the 2005 Toyota annual report below. You can navigate through the pages in the report by either clicking on the pages listed below, or by using the keyword search tool below to find specific information within the annual report.-
 1
1 -
 2
2 -
 3
3 -
 4
4 -
 5
5 -
 6
6 -
 7
7 -
 8
8 -
 9
9 -
 10
10 -
 11
11 -
 12
12 -
 13
13 -
 14
14 -
 15
15 -
 16
16 -
 17
17 -
18
-
19
-
20
-
21
-
22
-
23
-
24
-
25
-
26
-
27
-
28
-
29
-
30
-
31
-
32
-
33
-
34
-
35
-
36
-
37
-
38
-
39
-
40
-
41
-
42
-
43
-
44
-
45
-
46
-
47
-
48
-
49
-
50
-
51
-
52
-
53
-
54
-
55
-
56
-
57
-
58
-
59
-
60
-
61
-
62
-
63
-
64
-
65
-
66
-
67
-
68
-
69
-
70
-
71
-
72
-
73
-
74
-
75
-
76
-
77
-
78
-
79
-
80
-
81
-
82
-
83
-
84
-
85
-
86
-
87
-
88
-
89
-
90
-
91
-
92
-
93
-
94
-
95
-
96
-
97
-
98
-
99
-
100
-
101
-
102
-
103
-
104
-
105
-
106
-
107
-
108
-
109
-
110
-
111
-
112
-
113
-
114
-
115
-
116
-
117
-
118
-
119
-
120
-
121
-
122
-
123
-
124
-
125
-
126
-
127
-
128
-
129
-
130
-
131
-
132
-
133
-
134
-
135
-
136
-
137
-
138
 |
 |
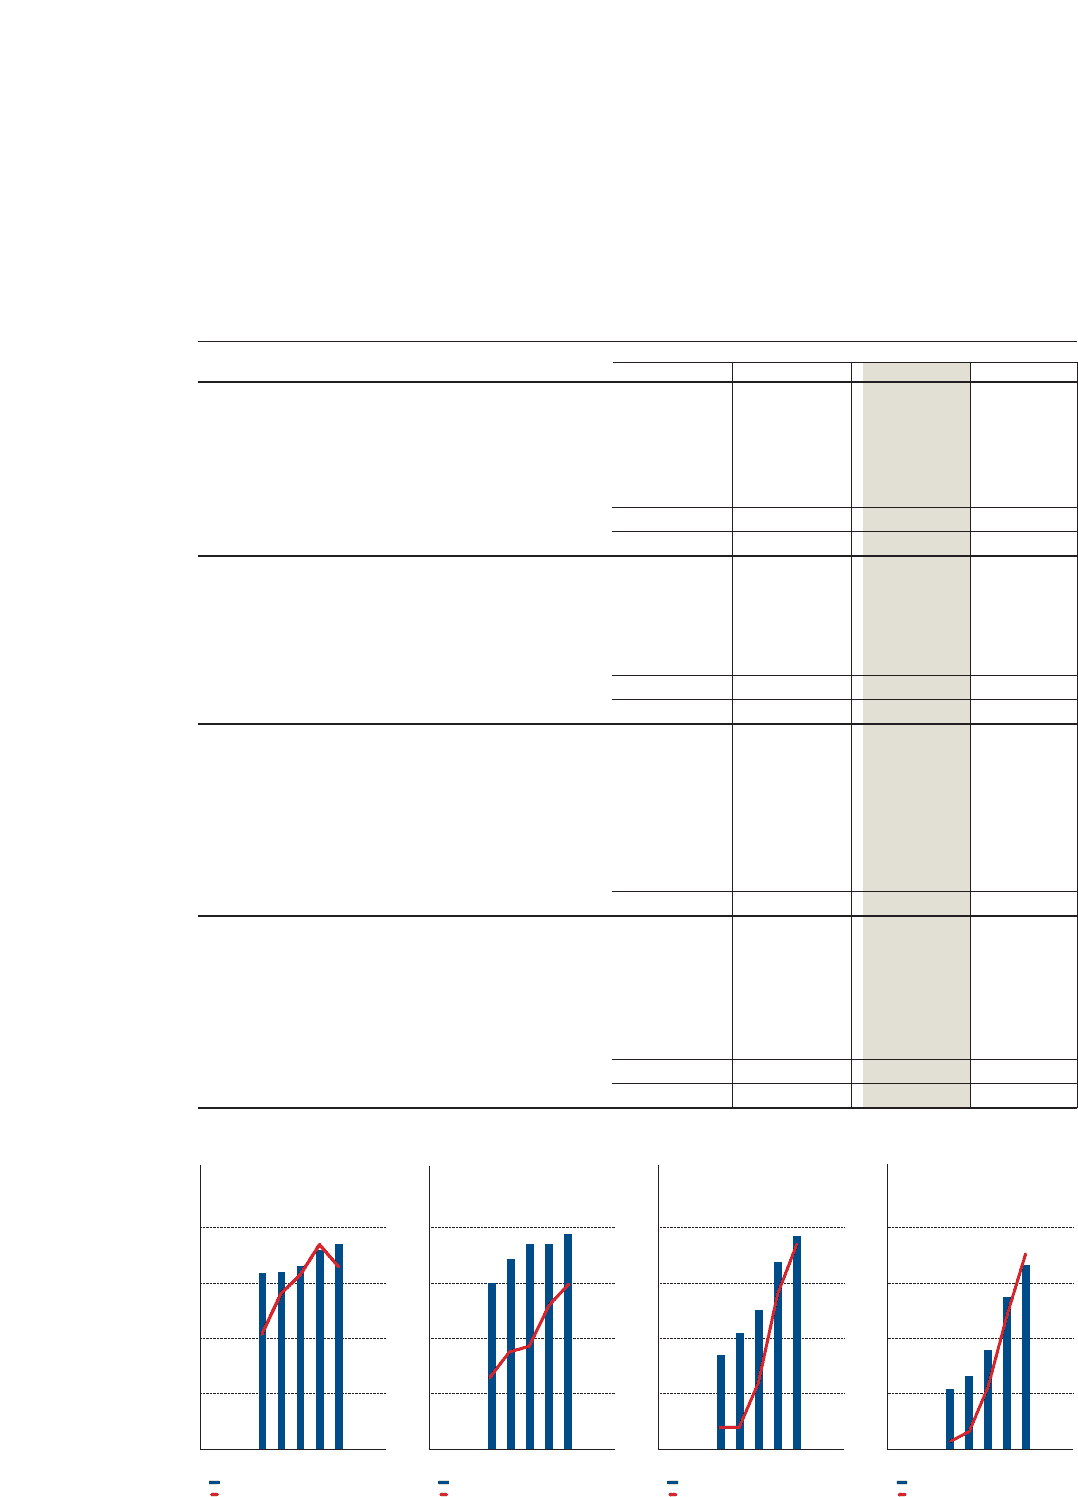
4
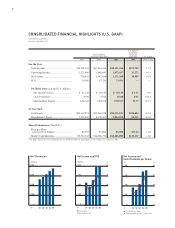
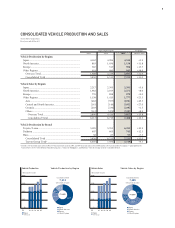
Yen in millions % change
2003 2004 2005 2004 vs 2005
By Business Operations:
Revenues:
Automotive .................................................................. ¥14,311,451 ¥15,973,826 ¥17,113,535 +7.1
Financial Services......................................................... 724,898 736,852 781,261 +6.0
All Other ...................................................................... 795,217 896,244 1,030,320 +15.0
Intersegment Elimination ........................................... (330,013) (312,162) (373,590) +19.7
Total Company........................................................ ¥15,501,553 ¥17,294,760 ¥18,551,526 +7.3
Operating Income:
Automotive .................................................................. ¥1,246,925 ¥1,518,954 ¥1,452,535 –4.4
Financial Services......................................................... 30,328 145,998 200,853 +37.6
All Other ...................................................................... 4,529 15,247 33,743 +121.3
Intersegment Elimination ........................................... (10,136) (13,309) (14,944) +12.3
Total Company........................................................ ¥1,271,646 ¥1,666,890 ¥1,672,187 +0.3
By Region:
Revenues (External Customers):
Japan............................................................................. ¥ 6,621,054 ¥ 7,167,704 ¥ 7,408,136 +3.4
North America............................................................. 5,929,803 5,910,422 6,187,624 +4.7
Europe.......................................................................... 1,514,683 2,018,969 2,305,450 +14.2
Other Regions .............................................................. 1,436,013 2,197,665 2,650,316 +20.6
Total Company........................................................ ¥15,501,553 ¥17,294,760 ¥18,551,526 +7.3
Operating Income:
Japan............................................................................. ¥ 944,290 ¥1,108,127 ¥ 987,242 –10.9
North America............................................................. 279,988 390,977 447,559 +14.5
Europe.......................................................................... 8,305 72,475 108,541 +49.8
Other Regions .............................................................. 45,626 96,913 141,226 +45.7
Intersegment Elimination ........................................... (6,563) (1,602) (12,381) +672.8
Total Company........................................................ ¥1,271,646 ¥1,666,890 ¥1,672,187 +0.3
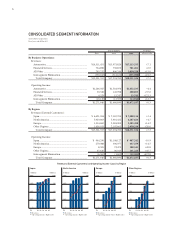
CONSOLIDATED SEGMENT INFORMATION
Toyota Motor Corporation
Fiscal years ended March 31
4,000 600
2,000 300
6,000 900
8,000 1,200
’01 ’02 ’03 ’04 ’05
00
FY
Japan
(¥ Billion) (¥ Billion)
Revenues
Operating income (Right scale)
3,200 300
1,600 150
4,800 450
6,400 600
’01 ’02 ’03 ’04 ’05
00
FY
North America
(¥ Billion) (¥ Billion)
Revenues
Operating income (Right scale)
1,200 40
600 0
1,800 80
2,400 120
’01 ’02 ’03 ’04 ’05
0 –40
FY
Europe
(¥ Billion) (¥ Billion)
Revenues
Operating income (loss) (Right scale)
1,600 80
800 40
2,400 120
3,200 160
’01 ’02 ’03 ’04 ’05
00
FY
Other Regions
(¥ Billion) (¥ Billion)
Revenues
Operating income (Right scale)
Revenues (External Customers) and Operating Income (Loss) by Region