Toyota 2005 Annual Report Download - page 65
Download and view the complete annual report
Please find page 65 of the 2005 Toyota annual report below. You can navigate through the pages in the report by either clicking on the pages listed below, or by using the keyword search tool below to find specific information within the annual report.
Income Taxes
Provision for income taxes increased by ¥164.3 billion
during fiscal 2004 compared with the prior year, primarily as
a result of the increase in income before income taxes and an
increased provision for taxes on undistributed earnings of
affiliated companies accounted for by the equity method.
The effective tax rate for fiscal 2004 decreased to 38.6% from
42.1% for the prior year due to the reduction in valuation
allowances and an increase in certain tax credits.
Minority Interest in Consolidated Subsidiaries
and Equity in Earnings of Affiliated Companies
Minority interest in consolidated subsidiaries increased by
¥31.1 billion to ¥42.6 billion during fiscal 2004 compared
with the prior year. This increase was mainly due to the
consolidation of the results of subsidiaries previously
accounted for on the equity basis.
Equity in earnings of affiliated companies during fiscal
2004 increased by ¥67.4 billion to ¥120.2 billion compared
with the prior year due to an increase in net income as a
result of favorable operations at most of the affiliated
companies, a net gain on the transfer of the substitutional
portion of an employee pension fund of an affiliate
company in Japan, partially offset by the acquisition and
consolidation of certain affiliate companies.
Net Income
Toyota’s net income increased by ¥411.1 billion, or 54.8%,
to ¥1,162.0 billion during fiscal 2004 compared with the
prior year.
Other Comprehensive Income and Loss
Other comprehensive income and loss increased by ¥736.6
billion to an income of ¥399.7 billion during fiscal 2004
compared with the prior year. This change resulted
primarily from an increase in unrealized holding gains on
securities during fiscal 2004 of ¥329.7 billion compared
with unrealized holding losses of ¥26.5 billion in the prior
year due to favorable market conditions in Japan and
minimum pension liability adjustments during fiscal 2004,
which resulted in a ¥273.3 billion gain adjustment
compared with a ¥171.9 billion loss adjustment in the
prior year due to the transfer of the substitutional portion
of certain employee pension funds, an increase in cash
contributions to the plans, and the increase in the market
value of assets of the plans, offset by an increase in the
losses for foreign currency translation adjustments during
fiscal 2004 of ¥203.3 billion compared with a losses of
¥139.3 billion in the prior year.
LIQUIDITY AND CAPITAL RESOURCES
Historically, Toyota has funded its capital expenditures
and research and development activities primarily through
cash generated by operations.
Toyota expects to sufficiently fund its capital expendi-
tures and research and development activities in fiscal
2006 primarily through cash and cash equivalents on hand
and increases in cash and cash equivalents from operating
activities. See “Information on the Company—Business
Overview—Capital Expenditures and Divestitures” in
Toyota’s annual report on Form 20-F for information
regarding Toyota’s material capital expenditures and
divestitures for fiscal 2003, 2004 and 2005 and information
concerning Toyota’s principal capital expenditures and
divestitures currently in progress.
Toyota funds its financing programs for customers and
dealers, including loans and leasing programs, from both
operating cash flows and borrowings by its finance
subsidiaries. Toyota seeks to expand its ability to raise
funds locally in markets throughout the world by
expanding its network of finance subsidiaries.
During fiscal 2005, Toyota changed its presentation of
cash flows attributed to origination and collection
activities of finance receivables relating to the sales of
inventory in its consolidated statement of cash flows from
investing activities to operating activities. This change in
presentation was based on concerns raised by the staff of
the Division of the Corporation Finance of the United
States Securities and Exchange Commission.
To conform the prior years’ statements of cash flows to
the new presentation adopted in fiscal 2005, Toyota
reclassified similar amounts reported for these items in
fiscal 2003 and 2004.
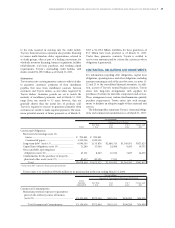
The following table sets forth a reconciliation of Toyota’s
current year presentation of cash flows attributed to
finance receivables compared to the presentation of cash
flows reported in prior periods.
MANAGEMENT’S DISCUSSION AND ANALYSIS OF FINANCIAL CONDITION AND RESULTS OF OPERATIONS >63


