Toyota 2005 Annual Report Download - page 115
Download and view the complete annual report
Please find page 115 of the 2005 Toyota annual report below. You can navigate through the pages in the report by either clicking on the pages listed below, or by using the keyword search tool below to find specific information within the annual report.-
 1
1 -
2
-
3
-
4
-
5
-
6
-
7
-
8
-
9
-
10
-
11
-
12
-
13
-
14
-
15
-
16
-
17
-
18
-
19
-
20
-
21
-
22
-
23
-
24
-
25
-
26
-
27
-
28
-
29
-
30
-
31
-
32
-
33
-
34
-
35
-
36
-
37
-
38
-
39
-
40
-
41
-
42
-
43
-
44
-
45
-
46
-
47
-
48
-
49
-
50
-
51
-
52
-
53
-
54
-
55
-
56
-
57
-
58
-
59
-
60
-
61
-
62
-
63
-
64
-
65
-
66
-
67
-
68
-
69
-
70
-
71
-
72
-
73
-
74
-
75
-
76
-
77
-
78
-
79
-
80
-
81
-
82
-
83
-
84
-
85
-
86
-
87
-
88
-
89
-
90
-
91
-
92
-
93
-
94
-
95
-
96
-
97
-
98
-
99
-
100
-
101
-
102
-
103
-
104
-
 105
105 -
 106
106 -
 107
107 -
 108
108 -
 109
109 -
 110
110 -
 111
111 -
 112
112 -
 113
113 -
 114
114 -
 115
115 -
 116
116 -
 117
117 -
 118
118 -
 119
119 -
 120
120 -
 121
121 -
 122
122 -
 123
123 -
 124
124 -
 125
125 -
126
-
127
-
128
-
129
-
130
-
131
-
132
-
133
-
134
-
135
-
136
-
137
-
138
 |
 |
NOTES TO CONSOLIDATED FINANCIAL STATEMENTS >113
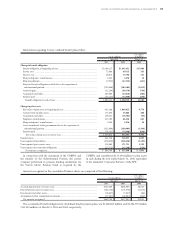
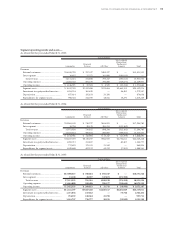
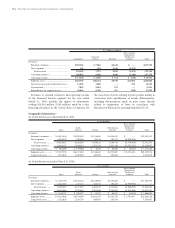
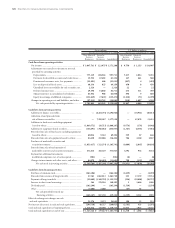
Segment operating results and assets—
As of and for the year ended March 31, 2003:
Yen in millions
Inter-segment
Elimination/
Financial Unallocated
Automotive Services All Other Amount Total
Revenues
External customers..................................... ¥14,300,799 ¥ 707,527 ¥493,227 ¥ — ¥15,501,553
Inter-segment ............................................. 10,652 17,371 301,990 (330,013) —
Total revenue ......................................... 14,311,451 724,898 795,217 (330,013) 15,501,553
Operating expenses .................................... 13,064,526 694,570 790,688 (319,877) 14,229,907
Operating income....................................... ¥ 1,246,925 ¥ 30,328 ¥ 4,529 ¥ (10,136) ¥ 1,271,646
Segment assets ............................................ ¥ 9,392,749 ¥7,392,486 ¥722,604 ¥2,645,135 ¥20,152,974
Investment in equity method investees..... 1,054,234 161,820 — 56,493 1,272,547
Depreciation ............................................... 657,814 192,624 20,198 — 870,636
Expenditures for segment assets................ 998,528 544,390 48,041 19,270 1,610,229
As of and for the year ended March 31, 2004:
Yen in millions
Inter-segment
Elimination/
Financial Unallocated
Automotive Services All Other Amount Total
Revenues
External customers..................................... ¥15,963,100 ¥ 716,727 ¥614,933 ¥ — ¥17,294,760
Inter-segment ............................................. 10,726 20,125 281,311 (312,162) —
Total revenue ......................................... 15,973,826 736,852 896,244 (312,162) 17,294,760
Operating expenses .................................... 14,454,872 590,854 880,997 (298,853) 15,627,870
Operating income....................................... ¥ 1,518,954 ¥ 145,998 ¥ 15,247 ¥ (13,309) ¥ 1,666,890
Segment assets ............................................ ¥10,207,395 ¥8,138,297 ¥941,925 ¥2,752,611 ¥22,040,228
Investment in equity method investees..... 1,092,713 211,657 — 60,407 1,364,777
Depreciation ............................................... 772,829 175,533 21,542 — 969,904
Expenditures for segment assets................ 1,020,608 432,222 43,212 (7,501) 1,488,541
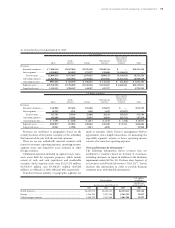
As of and for the year ended March 31, 2005:
Yen in millions
Inter-segment
Elimination/
Financial Unallocated
Automotive Services All Other Amount Total
Revenues
External customers..................................... ¥17,098,415 ¥ 760,664 ¥ 692,447 ¥ — ¥18,551,526
Inter-segment ............................................. 15,120 20,597 337,873 (373,590) —
Total revenue ......................................... 17,113,535 781,261 1,030,320 (373,590) 18,551,526
Operating expenses .................................... 15,661,000 580,408 996,577 (358,646) 16,879,339
Operating income....................................... ¥ 1,452,535 ¥ 200,853 ¥ 33,743 ¥ (14,944) ¥ 1,672,187
Segment assets ............................................ ¥11,141,197 ¥9,487,248 ¥1,025,517 ¥2,681,049 ¥24,335,011
Investment in equity method investees..... 1,271,044 215,642 — 75,746 1,562,432
Depreciation ............................................... 754,339 220,584 22,790 — 997,713
Expenditures for segment assets................ 1,161,757 726,777 50,555 (15,849) 1,923,240