Toyota 2005 Annual Report Download - page 39
Download and view the complete annual report
Please find page 39 of the 2005 Toyota annual report below. You can navigate through the pages in the report by either clicking on the pages listed below, or by using the keyword search tool below to find specific information within the annual report.-
 1
1 -
2
-
3
-
4
-
5
-
6
-
7
-
8
-
9
-
10
-
11
-
12
-
13
-
14
-
15
-
16
-
17
-
18
-
19
-
20
-
21
-
22
-
23
-
24
-
25
-
26
-
27
-
28
-
 29
29 -
 30
30 -
 31
31 -
 32
32 -
 33
33 -
 34
34 -
 35
35 -
 36
36 -
 37
37 -
 38
38 -
 39
39 -
 40
40 -
 41
41 -
 42
42 -
 43
43 -
 44
44 -
 45
45 -
 46
46 -
 47
47 -
 48
48 -
 49
49 -
50
-
51
-
52
-
53
-
54
-
55
-
56
-
57
-
58
-
59
-
60
-
61
-
62
-
63
-
64
-
65
-
66
-
67
-
68
-
69
-
70
-
71
-
72
-
73
-
74
-
75
-
76
-
77
-
78
-
79
-
80
-
81
-
82
-
83
-
84
-
85
-
86
-
87
-
88
-
89
-
90
-
91
-
92
-
93
-
94
-
95
-
96
-
97
-
98
-
99
-
100
-
101
-
102
-
103
-
104
-
105
-
106
-
107
-
108
-
109
-
110
-
111
-
112
-
113
-
114
-
115
-
116
-
117
-
118
-
119
-
120
-
121
-
122
-
123
-
124
-
125
-
126
-
127
-
128
-
129
-
130
-
131
-
132
-
133
-
134
-
135
-
136
-
137
-
138
 |
 |

BUSINESS OVERVIEW >37
30
10
40
’01 ’02 ’03 ’04 ’05
–300
900
300
0
0
20
600
1,200
–10
Revenues
Operating Income (Loss)
(Right scale)
(¥ Billion) (¥ Billion)
Revenues and
Operating Income (Loss)
FY
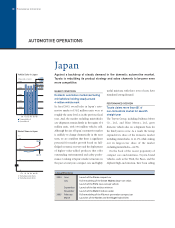
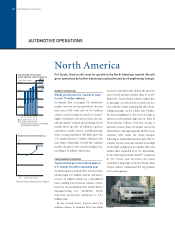
1,200
600
1,800
’01 ’02 ’03 ’04 ’05
0
12,000
6,000
18,000
0
Revenues
Operating income (Right scale)
(¥ Billion) (¥ Billion)
Revenues and
Operating Income
FY
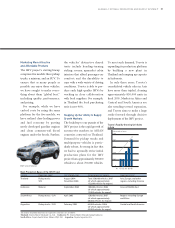
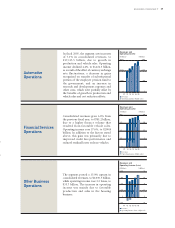
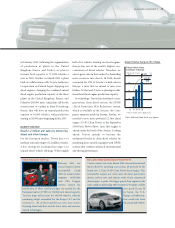
The segment posted a 15.0% upturn in
consolidated revenues, to ¥1,030.3 billion,
while operating income rose 2.2 times, to
¥33.7 billion. The increase in operating
income was mainly due to favorable
production and sales in the housing
business.
In fiscal 2005, the segment saw increases
of 7.1% in consolidated revenues, to
¥17,113.5 billion, due to growth in
production and vehicle sales. Operating
income declined 4.4%, to ¥1,452.5 billion,
as a result of the effect of currency exchange
rate fluctuations, a decrease in gains
recognized on transfer of substitutional
portion of the employee pension fund to
the government, and an increase in
research and development expenses and
other costs, which were partially offset by
the benefits of growth in production and
vehicle sales and cost reduction efforts.
Financial Services
Operations
Consolidated revenues grew 6.0% from
the previous fiscal year, to ¥781.2 billion,
due to a higher finance volume that
resulted from favorable vehicle sales.
Operating income rose 37.6%, to ¥200.8
billion. In addition to the factors stated
above, this gain was primarily due to
improved credit loss performance and
reduced residual losses on lease vehicles.
Automotive
Operations
Other Business
Operations
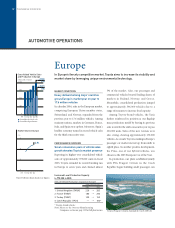
180
60
240
’01 ’02 ’03 ’04 ’05
0
600
200
120
400
800
0
Revenues
Operating income (Right scale)
(¥ Billion) (¥ Billion)
Revenues and
Operating Income
FY