Toyota 2005 Annual Report Download - page 90
Download and view the complete annual report
Please find page 90 of the 2005 Toyota annual report below. You can navigate through the pages in the report by either clicking on the pages listed below, or by using the keyword search tool below to find specific information within the annual report.-
 1
1 -
2
-
3
-
4
-
5
-
6
-
7
-
8
-
9
-
10
-
11
-
12
-
13
-
14
-
15
-
16
-
17
-
18
-
19
-
20
-
21
-
22
-
23
-
24
-
25
-
26
-
27
-
28
-
29
-
30
-
31
-
32
-
33
-
34
-
35
-
36
-
37
-
38
-
39
-
40
-
41
-
42
-
43
-
44
-
45
-
46
-
47
-
48
-
49
-
50
-
51
-
52
-
53
-
54
-
55
-
56
-
57
-
58
-
59
-
60
-
61
-
62
-
63
-
64
-
65
-
66
-
67
-
68
-
69
-
70
-
71
-
72
-
73
-
74
-
75
-
76
-
77
-
78
-
79
-
 80
80 -
 81
81 -
 82
82 -
 83
83 -
 84
84 -
 85
85 -
 86
86 -
 87
87 -
 88
88 -
 89
89 -
 90
90 -
 91
91 -
 92
92 -
 93
93 -
 94
94 -
 95
95 -
 96
96 -
 97
97 -
 98
98 -
 99
99 -
 100
100 -
101
-
102
-
103
-
104
-
105
-
106
-
107
-
108
-
109
-
110
-
111
-
112
-
113
-
114
-
115
-
116
-
117
-
118
-
119
-
120
-
121
-
122
-
123
-
124
-
125
-
126
-
127
-
128
-
129
-
130
-
131
-
132
-
133
-
134
-
135
-
136
-
137
-
138
 |
 |

88 >NOTES TO CONSOLIDATED FINANCIAL STATEMENTS
Unrealized losses continuously over a 12 month period
or more in the aggregate were not material at March 31,
2004 and 2005.
At March 31, 2004 and 2005, debt securities classified as
available-for-sale mainly consist of Japanese government
bonds and corporate debt securities with maturities from
one to ten years.
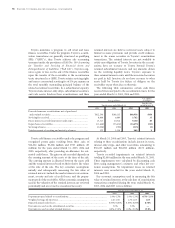
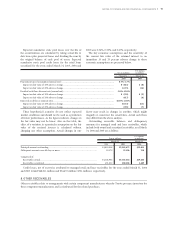
Proceeds from sales of available-for-sale securities were
¥197,985 million, ¥183,808 million and ¥121,369 million
($1,130 million) for the years ended March 31, 2003, 2004
and 2005, respectively. On those sales, gross realized gains
were ¥6,518 million, ¥8,780 million and ¥14,551 million
($135 million) and gross realized losses were ¥103 million,
¥139 million and ¥231 million ($2 million), respectively.
During the years ended March 31, 2003, 2004 and 2005,
Toyota recognized impairment losses on available-for-sale
securities of ¥111,346 million, ¥3,063 million, and ¥2,324
million ($22 million), respectively, which are included in
“Other income (loss), net” in the accompanying con-
solidated statements of income.
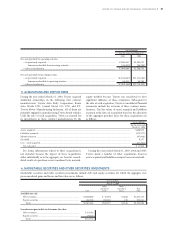
In the ordinary course of business, Toyota maintains
long-term investment securities, included in “Marketable
securities and other securities investments” and issued by
a number of non-public companies which are recorded at
cost, as their fair values were not readily determinable.
Management employs a systematic methodology to assess
the recoverability of such investments by reviewing the
financial viability of the underlying companies and the
prevailing market conditions in which these companies
operate to determine if Toyota’s investment in each
individual company is impaired and whether the
impairment is other-than-temporary. Toyota performs
this impairment test semi-annually for significant
investments recorded at cost. If the impairment is
determined to be other-than-temporary, the cost of the
investment is written-down by the impaired amount and
the losses are recognized currently in operations.
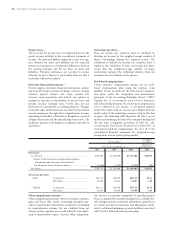
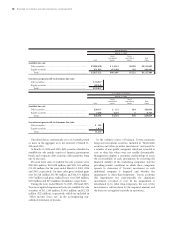
Yen in millions
March 31, 2005
Gross Gross
unrealized unrealized Fair
Cost gains losses value
Available-for-sale
Debt securities............................................................................. ¥2,205,420 ¥ 14,113 ¥6,928 ¥2,212,605
Equity securities.......................................................................... 451,903 453,494 593 904,804
Total ........................................................................................ ¥2,657,323 ¥467,607 ¥7,521 ¥3,117,409
Securities not practicable to determine fair value
Debt securities............................................................................. ¥ 19,917
Equity securities.......................................................................... 109,940
Total ........................................................................................ ¥129,857
U.S. dollars in millions
March 31, 2005
Gross Gross
unrealized unrealized Fair
Cost gains losses value
Available-for-sale
Debt securities............................................................................. $20,537 $ 131 $64 $20,604
Equity securities.......................................................................... 4,208 4,223 6 8,425
Total ........................................................................................ $24,745 $4,354 $70 $29,029
Securities not practicable to determine fair value
Debt securities............................................................................. $ 185
Equity securities.......................................................................... 1,025
Total ........................................................................................ $1,210