Toyota 2005 Annual Report Download - page 55
Download and view the complete annual report
Please find page 55 of the 2005 Toyota annual report below. You can navigate through the pages in the report by either clicking on the pages listed below, or by using the keyword search tool below to find specific information within the annual report.-
 1
1 -
2
-
3
-
4
-
5
-
6
-
7
-
8
-
9
-
10
-
11
-
12
-
13
-
14
-
15
-
16
-
17
-
18
-
19
-
20
-
21
-
22
-
23
-
24
-
25
-
26
-
27
-
28
-
29
-
30
-
31
-
32
-
33
-
34
-
35
-
36
-
37
-
38
-
39
-
40
-
41
-
42
-
43
-
44
-
 45
45 -
 46
46 -
 47
47 -
 48
48 -
 49
49 -
 50
50 -
 51
51 -
 52
52 -
 53
53 -
 54
54 -
 55
55 -
 56
56 -
 57
57 -
 58
58 -
 59
59 -
 60
60 -
 61
61 -
 62
62 -
 63
63 -
 64
64 -
 65
65 -
66
-
67
-
68
-
69
-
70
-
71
-
72
-
73
-
74
-
75
-
76
-
77
-
78
-
79
-
80
-
81
-
82
-
83
-
84
-
85
-
86
-
87
-
88
-
89
-
90
-
91
-
92
-
93
-
94
-
95
-
96
-
97
-
98
-
99
-
100
-
101
-
102
-
103
-
104
-
105
-
106
-
107
-
108
-
109
-
110
-
111
-
112
-
113
-
114
-
115
-
116
-
117
-
118
-
119
-
120
-
121
-
122
-
123
-
124
-
125
-
126
-
127
-
128
-
129
-
130
-
131
-
132
-
133
-
134
-
135
-
136
-
137
-
138
 |
 |

Toyota has continued to originate leases to finance new
Toyota vehicles. These leasing activities are subject to
residual value risk. Residual value risk arises when the
lessee of a vehicle does not exercise the option to purchase
the vehicle at the end of the lease. The number of vehicles
returned at the end of leases has decreased in recent years.
Approximately 50% of vehicles leased by Toyota Motor
Credit Corporation, Toyota’s financing subsidiary located
in the United States, were returned at the end of the
applicable lease periods during fiscal 2003 and 2004,
compared to a decrease in the return rate to approxi-
mately 40% in fiscal 2005 due to a narrowing spread
between contractual residual values and end of lease
market values. To avoid a loss on a vehicle returned to
Toyota at the end of its lease, Toyota must resell or re-
lease the vehicle at or above the residual value of the
vehicle. If Toyota is unable to recover the residual value of
the vehicle, it will incur a loss at the end of the lease, which
may offset a portion of the earnings on the lease. To the
extent that sales incentives remain an integral part of sales
promotions (reducing new vehicle prices and cost of
ownership), resale prices of used vehicles and, correspond-
ingly, the fair value of Toyota’s leased vehicles could be
subject to downward pressure. During fiscal 2004 and
2005, losses have decreased mainly due to a decrease in the
number of vehicles returned. See discussion in the Critical
Accounting Estimates section regarding “Investment in
Operating Leases” and note 2 to consolidated financial
statements regarding the allowance for residual values losses.
Toyota maintains an overall risk management strategy
to mitigate its exposure to fluctuations in interest rates
and currency exchange rates. Toyota enters into interest
rate swap agreements and cross currency interest rate
swap agreements to convert its fixed-rate debt to variable-
rate functional currency debt. Toyota formally documents
relationships between the derivative instrument and the
hedged item, as well as its risk-management strategy for
undertaking hedge transactions. If Toyota elects fair value
hedge accounting, derivative instruments are designated
with specific liabilities on Toyota’s consolidated balance
sheet, and the fair value quarterly change component of
each derivative instrument and hedged item is included in
the assessment of hedge effectiveness. Most interest rate
swap agreements are executed as an integral part of
specific debt transactions, achieving designated hedges.
Toyota uses cross currency interest rate swap agreements
to entirely hedge exposure to currency exchange rate
fluctuations on principal
and/or interest payments
and to manage its expo-
sure to interest rate fluctua-
tions. Certain derivative
instruments are entered
into to hedge interest rate
risk from an economic
perspective and are not
designated to specific assets
or liabilities on Toyota’s
consolidated balance sheet.
Accordingly, unrealized gains
or losses related to deriva-
tives that are not designated
Yen in millions
March 31,
2004 2005
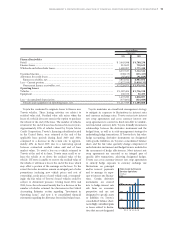
Finance Receivables
Retail ......................................................................................................................................... ¥ 3,643,998 ¥ 4,780,250
Finance leases.............................................................................................................................. 912,622 758,632
Wholesale and other dealer loans.............................................................................................. 1,680,907 1,773,440
6,237,527 7,312,322
Unearned income ....................................................................................................................... (298,153) (233,417)
Allowance for credit losses......................................................................................................... (87,462) (91,829)
Finance receivables, net.......................................................................................................... 5,851,912 6,987,076
Less – Current portion ............................................................................................................... (2,622,939) (3,010,135)
Noncurrent finance receivables, net...................................................................................... ¥ 3,228,973 ¥ 3,976,941
Operating Leases
Vehicles ....................................................................................................................................... ¥ 1,387,404 ¥ 1,736,238
Equipment .................................................................................................................................. 106,376 92,459
1,493,780 1,828,697
Less – Accumulated depreciation .............................................................................................. (375,861) (424,609)
Vehicles and equipment on operating leases, net................................................................. ¥ 1,117,919 ¥ 1,404,088
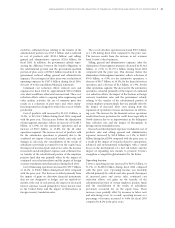
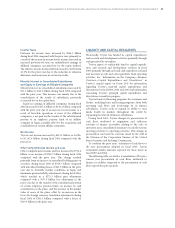
5,000
2,500
7,500
10,000
’01 ’02 ’03 ’04 ’05
0
FY
Total Assets by Financial
Services Operations
(¥ Billion)
MANAGEMENT’S DISCUSSION AND ANALYSIS OF FINANCIAL CONDITION AND RESULTS OF OPERATIONS >53