Toyota 2005 Annual Report Download - page 122
Download and view the complete annual report
Please find page 122 of the 2005 Toyota annual report below. You can navigate through the pages in the report by either clicking on the pages listed below, or by using the keyword search tool below to find specific information within the annual report.-
 1
1 -
2
-
3
-
4
-
5
-
6
-
7
-
8
-
9
-
10
-
11
-
12
-
13
-
14
-
15
-
16
-
17
-
18
-
19
-
20
-
21
-
22
-
23
-
24
-
25
-
26
-
27
-
28
-
29
-
30
-
31
-
32
-
33
-
34
-
35
-
36
-
37
-
38
-
39
-
40
-
41
-
42
-
43
-
44
-
45
-
46
-
47
-
48
-
49
-
50
-
51
-
52
-
53
-
54
-
55
-
56
-
57
-
58
-
59
-
60
-
61
-
62
-
63
-
64
-
65
-
66
-
67
-
68
-
69
-
70
-
71
-
72
-
73
-
74
-
75
-
76
-
77
-
78
-
79
-
80
-
81
-
82
-
83
-
84
-
85
-
86
-
87
-
88
-
89
-
90
-
91
-
92
-
93
-
94
-
95
-
96
-
97
-
98
-
99
-
100
-
101
-
102
-
103
-
104
-
105
-
106
-
107
-
108
-
109
-
110
-
111
-
 112
112 -
 113
113 -
 114
114 -
 115
115 -
 116
116 -
 117
117 -
 118
118 -
 119
119 -
 120
120 -
 121
121 -
 122
122 -
 123
123 -
 124
124 -
 125
125 -
 126
126 -
 127
127 -
 128
128 -
 129
129 -
 130
130 -
 131
131 -
 132
132 -
133
-
134
-
135
-
136
-
137
-
138
 |
 |

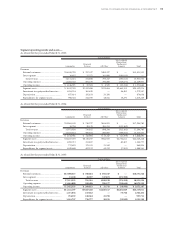
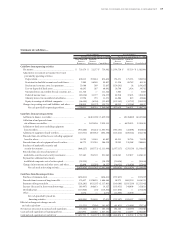
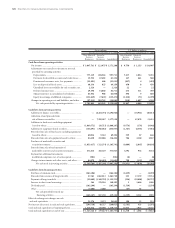
Yen in millions U.S. dollars in millions
For the year ended March 31, 2005 For the year ended March 31, 2005
Non-Financial Financial Non-Financial Financial
Services Services Services Services
Businesses Businesses Consolidated Businesses Businesses Consolidated
Cash flows from operating activities
Net income ....................................................................... ¥ 1,047,741 ¥ 123,975 ¥ 1,171,260 $ 9,756 $ 1,155 $ 10,907
Adjustments to reconcile net income to net cash
provided by operating activities
Depreciation................................................................. 777,129 220,584 997,713 7,237 2,054 9,291
Provision for doubtful accounts and credit losses ..... 15,752 47,402 63,154 147 441 588
Pension and severance costs, less payments ............... (53,401) 468 (52,933) (497) 4 (493)
Loss on disposal of fixed assets.................................... 48,334 825 49,159 450 8 458
Unrealized losses on available-for-sale securities, net.. 2,324 — 2,324 22 — 22
Deferred income taxes ................................................. 29,398 54,860 84,711 274 511 789
Minority interest in consolidated subsidiaries ........... 63,952 988 64,938 596 9 605
Equity in earnings of affiliated companies ................. (131,849) (7,622) (139,471) (1,228) (71) (1,299)
Changes in operating assets and liabilities, and other.... (97,535) 203,762 130,085 (910) 1,897 1,210
Net cash provided by operating activities .............. 1,701,845 645,242 2,370,940 15,847 6,008 22,078
Cash flows from investing activities
Additions to finance receivables......................................... — (8,264,794) (4,296,966) — (76,961) (40,013)
Collection of and proceeds from
sale of finance receivables ................................................. — 7,289,387 3,377,510 — 67,878 31,451
Additions to fixed assets excluding equipment
leased to others ................................................................. (1,049,572) (18,715) (1,068,287) (9,774) (174) (9,948)
Additions to equipment leased to others ........................... (146,891) (708,062) (854,953) (1,367) (6,593) (7,961)
Proceeds from sales of fixed assets excluding equipment
leased to others ................................................................. 60,034 9,362 69,396 559 87 646
Proceeds from sales of equipment leased to others........... 84,450 232,006 316,456 786 2,160 2,947
Purchases of marketable securities and
security investments.......................................................... (1,053,417) (112,374) (1,165,791) (9,809) (1,047) (10,856)
Proceeds from sales of and maturity of
marketable securities and security investments............... 471,614 102,329 573,943 4,392 952 5,344
Payment for additional investments
in affiliated companies, net of cash acquired................... (901) — (901) (8) — (8)
Changes in investments and other assets, and other......... 84,979 (16,485) (11,603) 790 (152) (107)
Net cash used in investing activities.......................... (1,549,704) (1,487,346) (3,061,196) (14,431) (13,850) (28,505)
Cash flows from financing activities
Purchase of common stock................................................. (264,106) — (264,106) (2,459) — (2,459)
Proceeds from issuance of long-term debt ........................ 27,363 1,862,012 1,863,710 255 17,339 17,354
Payments of long-term debt ............................................... (59,689) (1,160,710) (1,155,223) (556) (10,808) (10,757)
Increase in short-term borrowings..................................... 564 178,956 140,302 5 1,666 1,306
Dividends paid..................................................................... (165,299) — (165,299) (1,539) — (1,539)
Other.................................................................................... (7,000) 7,000 — (65) 65 —
Net cash provided by (used in)
financing activities.................................................... (468,167) 887,258 419,384 (4,359) 8,262 3,905
Effect of exchange rate changes on cash
and cash equivalents .............................................................. 21,276 3,573 24,849 198 33 231
Net increase (decrease) in cash and cash equivalents ............ (294,750) 48,727 (246,023) (2,745) 453 (2,291)
Cash and cash equivalents at beginning of year..................... 1,618,876 110,900 1,729,776 15,075 1,033 16,107
Cash and cash equivalents at end of year ............................... ¥ 1,324,126 ¥ 159,627 ¥ 1,483,753 $ 12,330 $ 1,486 $ 13,816
120 >NOTES TO CONSOLIDATED FINANCIAL STATEMENTS