Toyota 2005 Annual Report Download - page 116
Download and view the complete annual report
Please find page 116 of the 2005 Toyota annual report below. You can navigate through the pages in the report by either clicking on the pages listed below, or by using the keyword search tool below to find specific information within the annual report.-
 1
1 -
2
-
3
-
4
-
5
-
6
-
7
-
8
-
9
-
10
-
11
-
12
-
13
-
14
-
15
-
16
-
17
-
18
-
19
-
20
-
21
-
22
-
23
-
24
-
25
-
26
-
27
-
28
-
29
-
30
-
31
-
32
-
33
-
34
-
35
-
36
-
37
-
38
-
39
-
40
-
41
-
42
-
43
-
44
-
45
-
46
-
47
-
48
-
49
-
50
-
51
-
52
-
53
-
54
-
55
-
56
-
57
-
58
-
59
-
60
-
61
-
62
-
63
-
64
-
65
-
66
-
67
-
68
-
69
-
70
-
71
-
72
-
73
-
74
-
75
-
76
-
77
-
78
-
79
-
80
-
81
-
82
-
83
-
84
-
85
-
86
-
87
-
88
-
89
-
90
-
91
-
92
-
93
-
94
-
95
-
96
-
97
-
98
-
99
-
100
-
101
-
102
-
103
-
104
-
105
-
 106
106 -
 107
107 -
 108
108 -
 109
109 -
 110
110 -
 111
111 -
 112
112 -
 113
113 -
 114
114 -
 115
115 -
 116
116 -
 117
117 -
 118
118 -
 119
119 -
 120
120 -
 121
121 -
 122
122 -
 123
123 -
 124
124 -
 125
125 -
 126
126 -
127
-
128
-
129
-
130
-
131
-
132
-
133
-
134
-
135
-
136
-
137
-
138
 |
 |

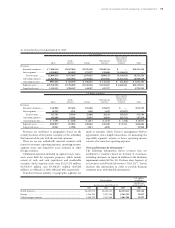
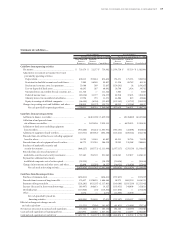
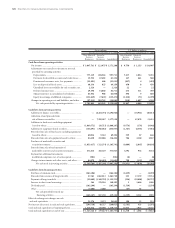
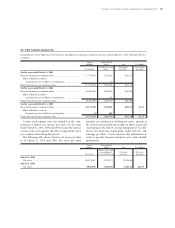
114 >NOTES TO CONSOLIDATED FINANCIAL STATEMENTS
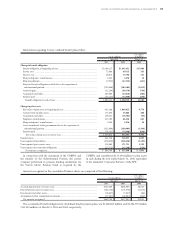
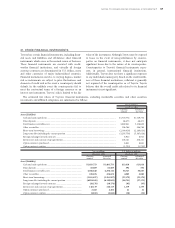
Revenues to external customers and operating income
of the Financial Services segment for the year ended
March 31, 2005, includes the impact of adjustments
totaling ¥14,991 million ($140 million) made by a sales
financing subsidiary in the United States of America for
the correction of errors relating to prior periods mainly in
connection with capitalization of certain disbursements,
including disbursements made in prior years, directly
related to origination of loans in accordance with
Statement of Financial Accounting Standards No. 91.
Geographic Information—
As of and for the year ended March 31, 2003:
Yen in millions
Inter-segment
Elimination/
North Other foreign Unallocated
Japan America Europe countries Amount Total
Revenues
External customers...... ¥ 6,621,054 ¥5,929,803 ¥1,514,683 ¥1,436,013 ¥ — ¥15,501,553
Inter-segment .............. 4,224,573 289,036 85,138 110,731 (4,709,478) —
Total revenue .......... 10,845,627 6,218,839 1,599,821 1,546,744 (4,709,478) 15,501,553
Operating expenses ..... 9,901,337 5,938,851 1,591,516 1,501,118 (4,702,915) 14,229,907
Operating income........ ¥ 944,290 ¥ 279,988 ¥ 8,305 ¥ 45,626 ¥ (6,563) ¥ 1,271,646
Segment assets ............. ¥ 9,272,330 ¥6,217,941 ¥1,516,360 ¥1,072,887 ¥ 2,073,456 ¥20,152,974
Long-lived assets.......... 2,732,654 1,778,892 410,389 281,944 — 5,203,879
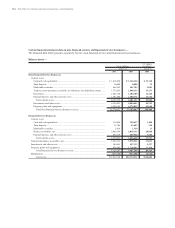
As of and for the year ended March 31, 2004:
Yen in millions
Inter-segment
Elimination/
North Other foreign Unallocated
Japan America Europe countries Amount Total
Revenues
External customers...... ¥ 7,167,704 ¥5,910,422 ¥2,018,969 ¥2,197,665 ¥ — ¥17,294,760
Inter-segment .............. 4,422,283 217,217 145,372 164,218 (4,949,090) —
Total revenue .......... 11,589,987 6,127,639 2,164,341 2,361,883 (4,949,090) 17,294,760
Operating expenses ..... 10,481,860 5,736,662 2,091,866 2,264,970 (4,947,488) 15,627,870
Operating income........ ¥ 1,108,127 ¥ 390,977 ¥ 72,475 ¥ 96,913 ¥ (1,602) ¥ 1,666,890
Segment assets ............. ¥10,210,904 ¥6,674,694 ¥1,842,947 ¥1,567,276 ¥ 1,744,407 ¥22,040,228
Long-lived assets.......... 3,032,629 1,536,550 448,954 336,514 — 5,354,647
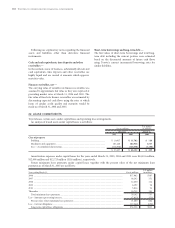
U.S. dollars in millions
Inter-segment
Elimination/
Financial Unallocated
Automotive Services All Other Amount Total
Revenues
External customers..................................... $159,218 $ 7,083 $6,448 $ — $172,749
Inter-segment ............................................. 141 192 3,146 (3,479) —
Total revenue ......................................... 159,359 7,275 9,594 (3,479) 172,749
Operating expenses .................................... 145,833 5,405 9,280 (3,340) 157,178
Operating income....................................... $ 13,526 $ 1,870 $ 314 $ (139) $ 15,571
Segment assets ............................................ $103,745 $88,344 $9,549 $24,966 $226,604
Investment in equity method investees..... 11,836 2,008 — 705 14,549
Depreciation ............................................... 7,025 2,054 212 — 9,291
Expenditures for segment assets................ 10,818 6,768 471 (148) 17,909