Toyota 2005 Annual Report Download - page 118
Download and view the complete annual report
Please find page 118 of the 2005 Toyota annual report below. You can navigate through the pages in the report by either clicking on the pages listed below, or by using the keyword search tool below to find specific information within the annual report.-
 1
1 -
2
-
3
-
4
-
5
-
6
-
7
-
8
-
9
-
10
-
11
-
12
-
13
-
14
-
15
-
16
-
17
-
18
-
19
-
20
-
21
-
22
-
23
-
24
-
25
-
26
-
27
-
28
-
29
-
30
-
31
-
32
-
33
-
34
-
35
-
36
-
37
-
38
-
39
-
40
-
41
-
42
-
43
-
44
-
45
-
46
-
47
-
48
-
49
-
50
-
51
-
52
-
53
-
54
-
55
-
56
-
57
-
58
-
59
-
60
-
61
-
62
-
63
-
64
-
65
-
66
-
67
-
68
-
69
-
70
-
71
-
72
-
73
-
74
-
75
-
76
-
77
-
78
-
79
-
80
-
81
-
82
-
83
-
84
-
85
-
86
-
87
-
88
-
89
-
90
-
91
-
92
-
93
-
94
-
95
-
96
-
97
-
98
-
99
-
100
-
101
-
102
-
103
-
104
-
105
-
106
-
107
-
 108
108 -
 109
109 -
 110
110 -
 111
111 -
 112
112 -
 113
113 -
 114
114 -
 115
115 -
 116
116 -
 117
117 -
 118
118 -
 119
119 -
 120
120 -
 121
121 -
 122
122 -
 123
123 -
 124
124 -
 125
125 -
 126
126 -
 127
127 -
 128
128 -
129
-
130
-
131
-
132
-
133
-
134
-
135
-
136
-
137
-
138
 |
 |

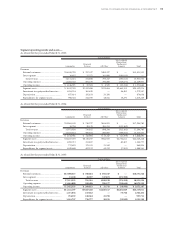
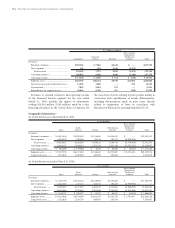
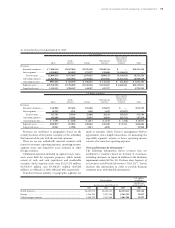
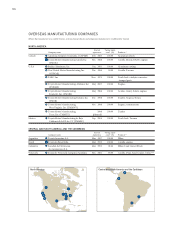
116 >NOTES TO CONSOLIDATED FINANCIAL STATEMENTS
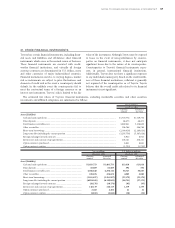
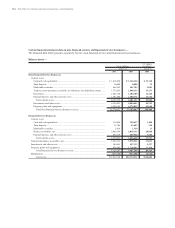
Certain financial statement data on non-financial services and financial services businesses—
The financial data below presents separately Toyota’s non-financial services and financial services businesses.
Balance sheets—
U.S. dollars
Yen in millions in millions
March 31, March 31,
2004 2005 2005
Non-Financial Services Businesses
Current assets
Cash and cash equivalents...................................................................................... ¥ 1,618,876 ¥ 1,324,126 $ 12,330
Time deposits.......................................................................................................... 16,689 8,006 74
Marketable securities .............................................................................................. 444,543 541,785 5,045
Trade accounts and notes receivable, less allowance for doubtful accounts ....... 1,570,205 1,640,155 15,273
Inventories............................................................................................................... 1,083,326 1,306,709 12,168
Prepaid expenses and other current assets ............................................................ 1,391,600 1,580,371 14,716
Total current assets............................................................................................. 6,125,239 6,401,152 59,606
Investments and other assets.................................................................................. 4,254,625 4,804,843 44,742
Property, plant and equipment.............................................................................. 4,398,163 4,579,052 42,640
Total Non-Financial Services Businesses assets................................................ 14,778,027 15,785,047 146,988
Financial Services Businesses
Current assets
Cash and cash equivalents...................................................................................... 110,900 159,627 1,486
Time deposits.......................................................................................................... 51,784 55,603 518
Marketable securities .............................................................................................. 3,914 1,339 13
Finance receivables, net .......................................................................................... 2,608,340 3,010,135 28,030
Prepaid expenses and other current assets ............................................................ 605,019 609,946 5,680
Total current assets............................................................................................. 3,379,957 3,836,650 35,727
Noncurrent finance receivables, net........................................................................... 3,221,013 3,976,941 37,032
Investments and other assets ...................................................................................... 580,843 457,115 4,257
Property, plant and equipment .................................................................................. 956,484 1,216,542 11,328
Total Financial Services Businesses assets......................................................... 8,138,297 9,487,248 88,344
Eliminations ................................................................................................................ (876,096) (937,284) (8,728)
Total assets.......................................................................................................... ¥22,040,228 ¥24,335,011 $226,604