Supercuts 2010 Annual Report Download - page 89
Download and view the complete annual report
Please find page 89 of the 2010 Supercuts annual report below. You can navigate through the pages in the report by either clicking on the pages listed below, or by using the keyword search tool below to find specific information within the annual report.-
 1
1 -
2
-
3
-
4
-
5
-
6
-
7
-
8
-
9
-
10
-
11
-
12
-
13
-
14
-
15
-
16
-
17
-
18
-
19
-
20
-
21
-
22
-
23
-
24
-
25
-
26
-
27
-
28
-
29
-
30
-
31
-
32
-
33
-
34
-
35
-
36
-
37
-
38
-
39
-
40
-
41
-
42
-
43
-
44
-
45
-
46
-
47
-
48
-
49
-
50
-
51
-
52
-
53
-
54
-
55
-
56
-
57
-
58
-
59
-
60
-
61
-
62
-
63
-
64
-
65
-
66
-
67
-
68
-
69
-
70
-
71
-
72
-
73
-
74
-
75
-
76
-
77
-
78
-
 79
79 -
 80
80 -
 81
81 -
 82
82 -
 83
83 -
 84
84 -
 85
85 -
 86
86 -
 87
87 -
 88
88 -
 89
89 -
 90
90 -
 91
91 -
 92
92 -
 93
93 -
 94
94 -
 95
95 -
 96
96 -
 97
97 -
 98
98 -
 99
99 -
100
-
101
-
102
-
103
-
104
-
105
-
106
-
107
-
108
-
109
-
110
-
111
-
112
-
113
-
114
-
115
-
116
-
117
-
118
-
119
-
120
-
121
-
122
-
123
-
124
-
125
-
126
-
127
-
128
-
129
-
130
-
131
-
132
-
133
-
134
-
135
-
136
-
137
-
138
-
139
-
140
-
141
-
142
-
143
-
144
-
145
-
146
-
147
-
148
-
149
-
150
-
151
-
152
-
153
-
154
-
155
-
156
-
157
-
158
-
159
-
160
-
161
-
162
-
163
-
164
-
165
-
166
-
167
-
168
-
169
-
170
-
171
-
172
-
173
-
174
-
175
-
176
-
177
-
178
-
179
-
180
-
181
-
182
-
183
-
184
-
185
-
186
-
187
-
188
-
189
-
190
-
191
-
192
-
193
-
194
-
195
-
196
-
197
-
198
-
199
-
200
-
201
-
202
-
203
-
204
-
205
-
206
-
207
-
208
-
209
-
210
-
211
-
212
-
213
-
214
-
215
-
216
-
217
-
218
-
219
-
220
-
221
 |
 |

Table of Contents
NOTES TO CONSOLIDATED FINANCIAL STATEMENTS (Continued)
1. BUSINESS DESCRIPTION AND SUMMARY OF SIGNIFICANT ACCOUNTING POLICIES (Continued)
however, it is a single model for all liability claims rather than the four separate models used for workers' compensation.
The health insurance analysis utilizes trailing twelve months of paid and 24 months of incurred medical and prescription claims to project
the amount of incurred but not yet reported claims liability amount. The lag factors are developed based on the Company's specific claim data
utilizing a completion factor methodology. The developed factor, expressed as a percentage of paid claims, is applied to the trailing twelve
months of paid claims to calculate the estimated liability amount. The calculated liability amount is reviewed for reasonableness based on
reserve adequacy ranges for historical periods by testing prior reserve levels against actual expenses to date.
Although the Company does not expect the amounts ultimately paid to differ significantly from the estimates, self-insurance accruals
could be affected if future claims experience differs significantly from the historical trends and actuarial assumptions. For fiscal years 2010,
2009, and 2008, the Company recorded decreases in expense from changes in estimates related to prior year open policy periods related to
continuing operations of $1.7, $9.9, and $6.9 million, respectively. A 10.0 percent change in the self-insurance reserve would affect income
from continuing operations before income taxes and equity in income of affiliated companies by $4.5, $4.0, and $4.7 million for the three years
ended June 30, 2010, 2009 and 2008, respectively. The Company updates loss projections each year and adjusts its recorded liability to reflect
the current projections. The updated loss projections consider new claims and developments associated with existing claims for each open
policy period. As certain claims can take years to settle, the Company has multiple policy periods open at any point in time.
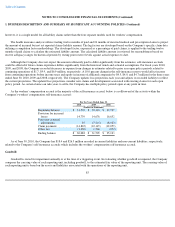
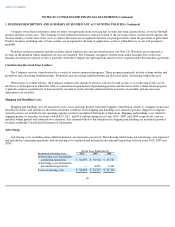
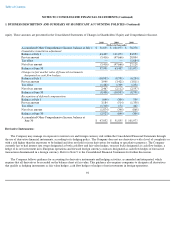
As the workers' compensation accrual is the majority of the self-insurance accrual, below is a rollforward of the activity within the
Company's workers' compensation self-insurance accrual:
As of June 30, 2010, the Company has $18.4 and $26.5 million recorded in current liabilities and non-current liabilities, respectively,
related to the Company's self-insurance accruals which includes the workers' compensation self-insurance accrual.
Goodwill:
Goodwill is tested for impairment annually or at the time of a triggering event. In evaluating whether goodwill is impaired, the Company
compares the carrying value of each reporting unit, including goodwill, to the estimated fair value of the reporting unit. The carrying value of
each reporting unit is based on the assets and liabilities associated with the operations of the reporting unit,
85
For the Years Ended June 30,
2010 2009 2008
(Dollars in thousands)
Beginning balance
$
31,505
$
35,123
$
39,727
Provision for incurred
losses
14,739
14,676
16,652
Prior year actuarial
adjustments
35
(7,715
)
(8,923
)
Claim payments
(14,867
)
(12,145
)
(12,059
)
Other, net
(1,330
)
1,566
(274
)
Ending balance
$
30,082
$
31,505
$
35,123