Supercuts 2010 Annual Report Download - page 47
Download and view the complete annual report
Please find page 47 of the 2010 Supercuts annual report below. You can navigate through the pages in the report by either clicking on the pages listed below, or by using the keyword search tool below to find specific information within the annual report.-
 1
1 -
2
-
3
-
4
-
5
-
6
-
7
-
8
-
9
-
10
-
11
-
12
-
13
-
14
-
15
-
16
-
17
-
18
-
19
-
20
-
21
-
22
-
23
-
24
-
25
-
26
-
27
-
28
-
29
-
30
-
31
-
32
-
33
-
34
-
35
-
36
-
 37
37 -
 38
38 -
 39
39 -
 40
40 -
 41
41 -
 42
42 -
 43
43 -
 44
44 -
 45
45 -
 46
46 -
 47
47 -
 48
48 -
 49
49 -
 50
50 -
 51
51 -
 52
52 -
 53
53 -
 54
54 -
 55
55 -
 56
56 -
 57
57 -
58
-
59
-
60
-
61
-
62
-
63
-
64
-
65
-
66
-
67
-
68
-
69
-
70
-
71
-
72
-
73
-
74
-
75
-
76
-
77
-
78
-
79
-
80
-
81
-
82
-
83
-
84
-
85
-
86
-
87
-
88
-
89
-
90
-
91
-
92
-
93
-
94
-
95
-
96
-
97
-
98
-
99
-
100
-
101
-
102
-
103
-
104
-
105
-
106
-
107
-
108
-
109
-
110
-
111
-
112
-
113
-
114
-
115
-
116
-
117
-
118
-
119
-
120
-
121
-
122
-
123
-
124
-
125
-
126
-
127
-
128
-
129
-
130
-
131
-
132
-
133
-
134
-
135
-
136
-
137
-
138
-
139
-
140
-
141
-
142
-
143
-
144
-
145
-
146
-
147
-
148
-
149
-
150
-
151
-
152
-
153
-
154
-
155
-
156
-
157
-
158
-
159
-
160
-
161
-
162
-
163
-
164
-
165
-
166
-
167
-
168
-
169
-
170
-
171
-
172
-
173
-
174
-
175
-
176
-
177
-
178
-
179
-
180
-
181
-
182
-
183
-
184
-
185
-
186
-
187
-
188
-
189
-
190
-
191
-
192
-
193
-
194
-
195
-
196
-
197
-
198
-
199
-
200
-
201
-
202
-
203
-
204
-
205
-
206
-
207
-
208
-
209
-
210
-
211
-
212
-
213
-
214
-
215
-
216
-
217
-
218
-
219
-
220
-
221
 |
 |

Table of Contents
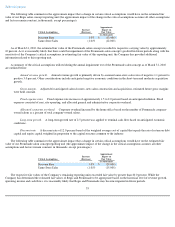
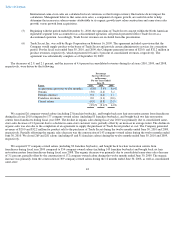
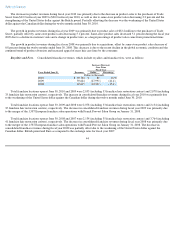
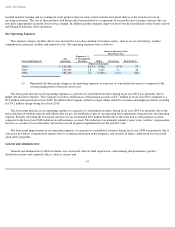
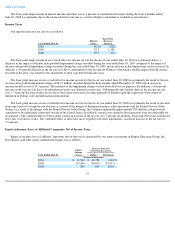
Gross Margin (Excluding Depreciation)
Our cost of revenues primarily includes labor costs related to salon employees and hair restoration center employees, the cost of product
used in providing services and the cost of products sold to customers and franchisees. The resulting gross margin was as follows:
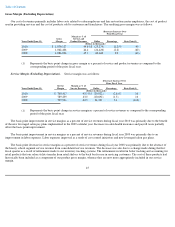
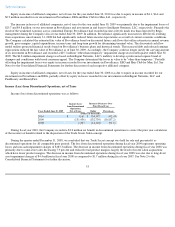
Service Margin (Excluding Depreciation). Service margin was as follows:
The basis point improvement in service margins as a percent of service revenues during fiscal year 2010 was primarily due to the benefit
of the new leveraged salon pay plans implemented in the 2009 calendar year. Increases in salon health insurance and payroll taxes partially
offset the basis point improvement.
The basis point improvement in service margins as a percent of service revenues during fiscal year 2009 was primarily due to an
improvement in labor expenses. Labor expenses improved as a result of cost control initiatives and new leveraged salon pay plans.
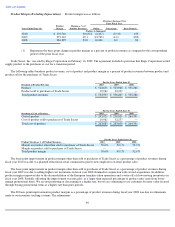
The basis point decrease in service margins as a percent of service revenues during fiscal year 2008 was primarily due to the absence of
the beauty school segment service revenue from consolidated service revenues. The decrease was also due to a change made during the first
fiscal quarter as a result of refinements made to our inventory tracking systems. The refinements resulted in better tracking and accounting for
retail products that our salon stylists transfer from retail shelves to the back bar for use in servicing customers. The cost of these products had
historically been included as a component of our product gross margin, whereas they are now more appropriately included in our service
margin.
45
(Decrease) Increase Over
Prior Fiscal Year
Years Ended June 30, Gross
Margin
Margin as % of
Service and
Product Revenues Dollar Percentage Basis Point(1)
(Dollars in thousands)
2010
$
1,039,127
44.8
%
$
(23,279
)
(2.2
)%
40
2009
1,062,406
44.4
(24,420
)
(2.2
)
(60
)
2008
1,086,826
45.0
40,643
3.9
(60
)
(1) Represents the basis point change in gross margin as a percent of service and product revenues as compared to the
corresponding period of the prior fiscal year.
(Decrease) Increase Over
Prior Fiscal Year
Years Ended June 30, Service
Margin Margin as % of
Service Revenues Dollar Percentage Basis Point(1)
(Dollars in thousands)
2010
$
768,417
43.1
%
$
(20,822
)
(2.6
)%
10
2009
789,239
43.0
(10,692
)
(1.3
)
10
2008
799,931
42.9
24,397
3.1
(110
)
(1) Represents the basis point change in service margin as a percent of service revenues as compared to the corresponding
period of the prior fiscal year.