Supercuts 2010 Annual Report Download - page 50
Download and view the complete annual report
Please find page 50 of the 2010 Supercuts annual report below. You can navigate through the pages in the report by either clicking on the pages listed below, or by using the keyword search tool below to find specific information within the annual report.-
 1
1 -
2
-
3
-
4
-
5
-
6
-
7
-
8
-
9
-
10
-
11
-
12
-
13
-
14
-
15
-
16
-
17
-
18
-
19
-
20
-
21
-
22
-
23
-
24
-
25
-
26
-
27
-
28
-
29
-
30
-
31
-
32
-
33
-
34
-
35
-
36
-
37
-
38
-
39
-
 40
40 -
 41
41 -
 42
42 -
 43
43 -
 44
44 -
 45
45 -
 46
46 -
 47
47 -
 48
48 -
 49
49 -
 50
50 -
 51
51 -
 52
52 -
 53
53 -
 54
54 -
 55
55 -
 56
56 -
 57
57 -
 58
58 -
 59
59 -
 60
60 -
61
-
62
-
63
-
64
-
65
-
66
-
67
-
68
-
69
-
70
-
71
-
72
-
73
-
74
-
75
-
76
-
77
-
78
-
79
-
80
-
81
-
82
-
83
-
84
-
85
-
86
-
87
-
88
-
89
-
90
-
91
-
92
-
93
-
94
-
95
-
96
-
97
-
98
-
99
-
100
-
101
-
102
-
103
-
104
-
105
-
106
-
107
-
108
-
109
-
110
-
111
-
112
-
113
-
114
-
115
-
116
-
117
-
118
-
119
-
120
-
121
-
122
-
123
-
124
-
125
-
126
-
127
-
128
-
129
-
130
-
131
-
132
-
133
-
134
-
135
-
136
-
137
-
138
-
139
-
140
-
141
-
142
-
143
-
144
-
145
-
146
-
147
-
148
-
149
-
150
-
151
-
152
-
153
-
154
-
155
-
156
-
157
-
158
-
159
-
160
-
161
-
162
-
163
-
164
-
165
-
166
-
167
-
168
-
169
-
170
-
171
-
172
-
173
-
174
-
175
-
176
-
177
-
178
-
179
-
180
-
181
-
182
-
183
-
184
-
185
-
186
-
187
-
188
-
189
-
190
-
191
-
192
-
193
-
194
-
195
-
196
-
197
-
198
-
199
-
200
-
201
-
202
-
203
-
204
-
205
-
206
-
207
-
208
-
209
-
210
-
211
-
212
-
213
-
214
-
215
-
216
-
217
-
218
-
219
-
220
-
221
 |
 |

Table of Contents
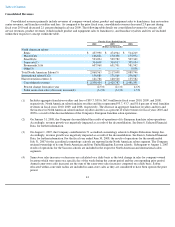
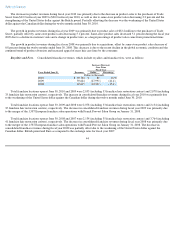
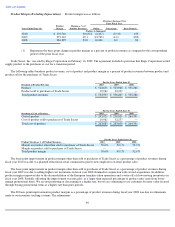
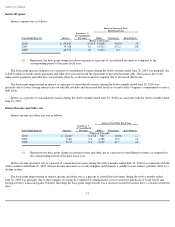
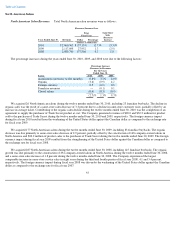
professional fees), including costs incurred to support franchise and hair restoration center operations. G&A expenses were as follows:
The basis point increase in G&A costs as a percentage of consolidated revenues during fiscal year 2010 was primarily due to negative
leverage from the decrease in same-store sales, partially offset by the continuation of cost savings initiatives implemented by the Company.
The basis point improvement in G&A costs as a percentage of consolidated revenues during fiscal year 2009 was primarily due to cost
savings initiatives implemented by the Company during the first half of fiscal year 2009 including the reduction of field supervisory staff and
the reduction of the fiscal year 2009 marketing budget. The basis point improvement was also related to the deconsolidation of the European
franchise salon operations.
The basis point improvement in G&A costs as a percentage of consolidated revenues during fiscal year 2008 was primarily due to the
deconsolidation of the European franchise salon operations and accredited cosmetology schools.
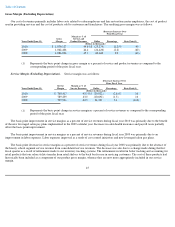
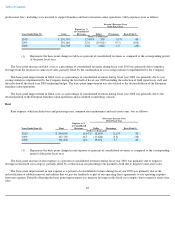
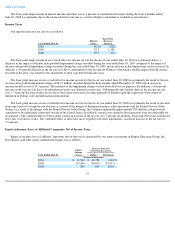
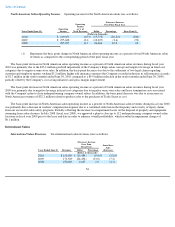
Rent
Rent expense, which includes base and percentage rent, common area maintenance and real estate taxes, was as follows:
The basis point increase in rent expense as a percent of consolidated revenues during fiscal year 2010 was primarily due to negative
leverage in this fixed cost category, partially offset by a reduction in our percentage rent payments, both due to negative same-store sales.
The basis point improvement in rent expense as a percent of consolidated revenues during fiscal year 2009 was primarily due to the
reclassification of rubbish removal and utilities that we pay our landlords as part of our operating lease agreements to site operating expense
from rent expense. Partially offsetting the basis point improvement was negative leverage in this fixed cost category due to negative same-
store
sales.
48
Increase (Decrease) Over
Prior Fiscal Year
Years Ended June 30, G&A
Expense as %
of Consolidated
Revenues Dollar Percentage Basis Point(1)
(Dollars in thousands)
2010
$
291,991
12.4
%
$
330
0.1
%
40
2009
291,661
12.0
(29,902
)
(9.3
)
(100
)
2008
321,563
13.0
3,840
1.2
(40
)
(1)
Represents the basis point change in G&A as a percent of consolidated revenues as compared to the corresponding period
of the prior fiscal year.
(Decrease) Increase Over
Prior Fiscal Year
Years Ended June 30, Rent
Expense as %
of Consolidated
Revenues Dollar Percentage Basis Point(1)
(Dollars in thousands)
2010
$
344,098
14.6
%
$
(3,694
)
(1.1
)%
30
2009
347,792
14.3
(13,684
)
(3.8
)
(30
)
2008
361,476
14.6
19,654
5.7
20
(1)
Represents the basis point change in rent expense as a percent of consolidated revenues as compared to the corresponding
period of the prior fiscal year.