Supercuts 2010 Annual Report Download - page 143
Download and view the complete annual report
Please find page 143 of the 2010 Supercuts annual report below. You can navigate through the pages in the report by either clicking on the pages listed below, or by using the keyword search tool below to find specific information within the annual report.-
 1
1 -
2
-
3
-
4
-
5
-
6
-
7
-
8
-
9
-
10
-
11
-
12
-
13
-
14
-
15
-
16
-
17
-
18
-
19
-
20
-
21
-
22
-
23
-
24
-
25
-
26
-
27
-
28
-
29
-
30
-
31
-
32
-
33
-
34
-
35
-
36
-
37
-
38
-
39
-
40
-
41
-
42
-
43
-
44
-
45
-
46
-
47
-
48
-
49
-
50
-
51
-
52
-
53
-
54
-
55
-
56
-
57
-
58
-
59
-
60
-
61
-
62
-
63
-
64
-
65
-
66
-
67
-
68
-
69
-
70
-
71
-
72
-
73
-
74
-
75
-
76
-
77
-
78
-
79
-
80
-
81
-
82
-
83
-
84
-
85
-
86
-
87
-
88
-
89
-
90
-
91
-
92
-
93
-
94
-
95
-
96
-
97
-
98
-
99
-
100
-
101
-
102
-
103
-
104
-
105
-
106
-
107
-
108
-
109
-
110
-
111
-
112
-
113
-
114
-
115
-
116
-
117
-
118
-
119
-
120
-
121
-
122
-
123
-
124
-
125
-
126
-
127
-
128
-
129
-
130
-
131
-
132
-
 133
133 -
 134
134 -
 135
135 -
 136
136 -
 137
137 -
 138
138 -
 139
139 -
 140
140 -
 141
141 -
 142
142 -
 143
143 -
 144
144 -
 145
145 -
 146
146 -
 147
147 -
 148
148 -
 149
149 -
 150
150 -
 151
151 -
 152
152 -
 153
153 -
154
-
155
-
156
-
157
-
158
-
159
-
160
-
161
-
162
-
163
-
164
-
165
-
166
-
167
-
168
-
169
-
170
-
171
-
172
-
173
-
174
-
175
-
176
-
177
-
178
-
179
-
180
-
181
-
182
-
183
-
184
-
185
-
186
-
187
-
188
-
189
-
190
-
191
-
192
-
193
-
194
-
195
-
196
-
197
-
198
-
199
-
200
-
201
-
202
-
203
-
204
-
205
-
206
-
207
-
208
-
209
-
210
-
211
-
212
-
213
-
214
-
215
-
216
-
217
-
218
-
219
-
220
-
221
 |
 |

Table of Contents
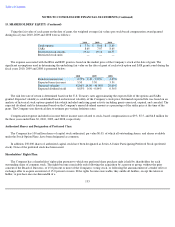
NOTES TO CONSOLIDATED FINANCIAL STATEMENTS (Continued)
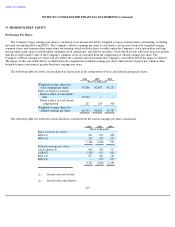
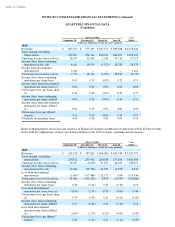
QUARTERLY FINANCIAL DATA
(Unaudited)
Quarter Ended
Year
Ended
September 30 December 31 March 31 June 30
(Dollars in thousands, except per share amounts)
2010
Revenues
$
605,550
$
575,365
$
587,571
$
589,948
$
2,358,434
Gross margin, excluding
depreciation
259,967
254,564
260,199
264,397
1,039,127
Operating income (loss)(a)(b)(c)
28,257
32,063
1,184
35,714
97,218
Income (loss) from continuing
operations(a)(b)(c)(d)
4,611
18,154
(1,525
)
18,339
39,579
Income from discontinued
operations(e)
3,161
—
—
—
3,161
Net income (loss)(a)(b)(c)(d)(e)
7,772
18,154
(1,525
)
18,339
42,740
Income (loss) from continuing
operations per share, basic
0.09
0.32
(0.03
)
0.32
0.71
Income (loss) from discontinued
operations per share, basic(e)
0.06
0.00
0.00
0.00
0.06
Net income (loss) per basic share
(f)
0.14
0.32
(0.03
)
0.32
0.77
Income (loss) from continuing
operations per share, diluted
0.09
0.30
(0.03
)
0.30
0.71
Income (loss) from discontinued
operations per share, diluted
(e)
0.06
0.00
0.00
0.00
0.05
Net income (loss) per diluted
share(f)
0.14
0.30
(0.03
)
0.30
0.75
Dividends declared per share
0.04
0.04
0.04
0.04
0.16
Refer to Management's Discussion and Analysis of Financial Condition and Results of Operations in Part II, Item 6 in this
Form 10
-
K for explanations of items which impacted fiscal year 2010 revenues, operating and net income.
Quarter Ended
Year
Ended
September 30 December 31 March 31 June 30
(Dollars in thousands, except per share amounts)
2009
Revenues
$
613,529
$
587,426
$
604,086
$
624,746
$
2,429,787
Gross margin, excluding
depreciation
270,522
255,936
260,788
275,160
1,062,406
Operating income (loss)(a)(b)(c)
34,037
(6,649
)
37,072
44,613
109,073
Income (loss) from continuing
operations(a)(b)(c)(d)
16,086
(25,786
)
21,025
(4,355
)
6,970
Loss from discontinued
operations(e)
(1,600
)
(117,466
)
(12,171
)
(199
)
(131,436
)
Net income (loss)(a)(b)(c)(d)(e)
14,486
(143,252
)
8,854
(4,554
)
(124,466
)
Income (loss) from continuing
operations per share, basic
0.38
(0.60
)
0.49
(0.10
)
0.16
Loss from discontinued
operations per share, basic(e)
(0.04
)
(2.74
)
(0.28
)
(0.00
)
(3.06
)
Net income (loss) per basic share
(f)
0.34
(3.34
)
0.21
(0.11
)
(2.90
)
Income (loss) from continuing
operations per share, diluted
0.37
(0.60
)
0.49
(0.10
)
0.16
Loss from discontinued
operations per share, diluted
(e)
(0.04
)
(2.74
)
(0.28
)
(0.00
)
(3.05
)
Net income (loss) per diluted
share(f)
0.34
(3.34
)
0.21
(0.11
)
(2.89
)